Texas Instruments 2012 Annual Report Download - page 7
Download and view the complete annual report
Please find page 7 of the 2012 Texas Instruments annual report below. You can navigate through the pages in the report by either clicking on the pages listed below, or by using the keyword search tool below to find specific information within the annual report.-
 1
1 -
 2
2 -
 3
3 -
 4
4 -
 5
5 -
 6
6 -
 7
7 -
 8
8 -
 9
9 -
 10
10 -
 11
11 -
 12
12 -
 13
13 -
 14
14 -
 15
15 -
 16
16 -
 17
17 -
 18
18 -
19
-
20
-
21
-
22
-
23
-
24
-
25
-
26
-
27
-
28
-
29
-
30
-
31
-
32
-
33
-
34
-
35
-
36
-
37
-
38
-
39
-
40
-
41
-
42
-
43
-
44
-
45
-
46
-
47
-
48
-
49
-
50
-
51
-
52
-
53
-
54
-
55
-
56
-
57
-
58
 |
 |

TEXAS INSTRUMENTS 2012 ANNUAL REPORT • 5
ANNUAL
REPORT
For Years Ended
December 31,
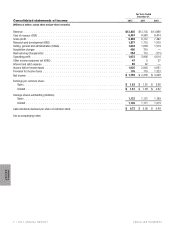
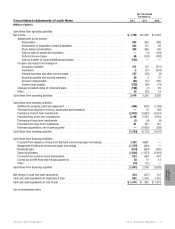
Consolidated statements of cash flows 2012 2011 2010
[Millions of dollars]
Cash flows from operating activities:
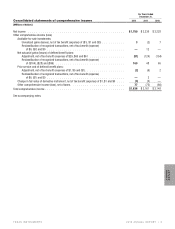
Net income . . . . . . . . . . . . . . . . . . . . . . . . . . . . . . . . . . . . . . . . . . . . . . . $ 1,759 $ 2,236 $ 3,228
Adjustments to net income:
Depreciation . . . . . . . . . . . . . . . . . . . . . . . . . . . . . . . . . . . . . . . . . . 957 904 865
Amortization of acquisition-related intangibles . . . . . . . . . . . . . . . . . . . . . . . . . 342 111 48
Stock-based compensation . . . . . . . . . . . . . . . . . . . . . . . . . . . . . . . . . . 263 269 190
Gain on sales of assets and divestiture . . . . . . . . . . . . . . . . . . . . . . . . . . . . . —(5) (144)
Deferred income taxes . . . . . . . . . . . . . . . . . . . . . . . . . . . . . . . . . . . . . 65 (119) (188)
Gain on transfer of Japan substitutional pension . . . . . . . . . . . . . . . . . . . . . . . . (144) — —
Increase (decrease) from changes in:
Accounts receivable . . . . . . . . . . . . . . . . . . . . . . . . . . . . . . . . . . . . . . 311 112 (231)
Inventories . . . . . . . . . . . . . . . . . . . . . . . . . . . . . . . . . . . . . . . . . . . 5(17) (304)
Prepaid expenses and other current assets . . . . . . . . . . . . . . . . . . . . . . . . . . . 227 (29) (8)
Accounts payable and accrued expenses . . . . . . . . . . . . . . . . . . . . . . . . . . . . 99 2 57
Accrued compensation . . . . . . . . . . . . . . . . . . . . . . . . . . . . . . . . . . . . . (82) (77) 246
Income taxes payable . . . . . . . . . . . . . . . . . . . . . . . . . . . . . . . . . . . . . (229) (85) (19)
Changes in funded status of retirement plans . . . . . . . . . . . . . . . . . . . . . . . . . . . (198) (7) 26
Other . . . . . . . . . . . . . . . . . . . . . . . . . . . . . . . . . . . . . . . . . . . . . . . . 39 (39) 54
Cash flows from operating activities . . . . . . . . . . . . . . . . . . . . . . . . . . . . . . . . . . 3,414 3,256 3,820
Cash flows from investing activities:
Additions to property, plant and equipment . . . . . . . . . . . . . . . . . . . . . . . . . . . . . (495) (816) (1,199)
Proceeds from insurance recovery, asset sales and divestiture . . . . . . . . . . . . . . . . . . . —16 148
Purchases of short-term investments . . . . . . . . . . . . . . . . . . . . . . . . . . . . . . . . (2,802) (3,653) (2,510)
Proceeds from short-term investments . . . . . . . . . . . . . . . . . . . . . . . . . . . . . . . 2,198 3,555 2,564
Purchases of long-term investments . . . . . . . . . . . . . . . . . . . . . . . . . . . . . . . . (1) (6) (8)
Proceeds from long-term investments . . . . . . . . . . . . . . . . . . . . . . . . . . . . . . . 61 157 147
Business acquisitions, net of cash acquired . . . . . . . . . . . . . . . . . . . . . . . . . . . . —(5,425) (199)
Cash flows from investing activities . . . . . . . . . . . . . . . . . . . . . . . . . . . . . . . . . . (1,039) (6,172) (1,057)
Cash flows from financing activities:
Proceeds from issuance of long-term debt and commercial paper borrowings . . . . . . . . . . . 1,492 4,697 —
Repayment of debt and commercial paper borrowings . . . . . . . . . . . . . . . . . . . . . . . (1,375) (200) —
Dividends paid . . . . . . . . . . . . . . . . . . . . . . . . . . . . . . . . . . . . . . . . . . . (819) (644) (592)
Stock repurchases . . . . . . . . . . . . . . . . . . . . . . . . . . . . . . . . . . . . . . . . . (1,800) (1,973) (2,454)
Proceeds from common stock transactions . . . . . . . . . . . . . . . . . . . . . . . . . . . . . 523 690 407
Excess tax benefit from share-based payments . . . . . . . . . . . . . . . . . . . . . . . . . . 38 31 13
Other . . . . . . . . . . . . . . . . . . . . . . . . . . . . . . . . . . . . . . . . . . . . . . . . (10) (12) —
Cash flows from financing activities . . . . . . . . . . . . . . . . . . . . . . . . . . . . . . . . . . (1,951) 2,589 (2,626)
Net change in cash and cash equivalents. . . . . . . . . . . . . . . . . . . . . . . . . . . . . . . . 424 (327) 137
Cash and cash equivalents at beginning of year . . . . . . . . . . . . . . . . . . . . . . . . . . . . 992 1,319 1,182
Cash and cash equivalents at end of year . . . . . . . . . . . . . . . . . . . . . . . . . . . . . . . $ 1,416 $ 992 $ 1,319
See accompanying notes.