Texas Instruments 2012 Annual Report Download - page 16
Download and view the complete annual report
Please find page 16 of the 2012 Texas Instruments annual report below. You can navigate through the pages in the report by either clicking on the pages listed below, or by using the keyword search tool below to find specific information within the annual report.-
 1
1 -
2
-
3
-
4
-
5
-
 6
6 -
 7
7 -
 8
8 -
 9
9 -
 10
10 -
 11
11 -
 12
12 -
 13
13 -
 14
14 -
 15
15 -
 16
16 -
 17
17 -
 18
18 -
 19
19 -
 20
20 -
 21
21 -
 22
22 -
 23
23 -
 24
24 -
 25
25 -
 26
26 -
27
-
28
-
29
-
30
-
31
-
32
-
33
-
34
-
35
-
36
-
37
-
38
-
39
-
40
-
41
-
42
-
43
-
44
-
45
-
46
-
47
-
48
-
49
-
50
-
51
-
52
-
53
-
54
-
55
-
56
-
57
-
58
 |
 |

ANNUAL
REPORT
TEXAS INSTRUMENTS14 • 2012 ANNUAL REPORT
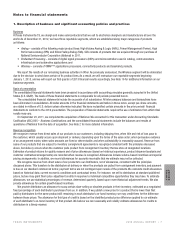
4. Losses associated with the 2011 earthquake in Japan
On March 11, 2011, a magnitude 9.0 earthquake struck near two of our three semiconductor manufacturing facilities in Japan. Our
manufacturing site in Miho suffered substantial damage during the earthquake, our facility in Aizu experienced significantly less damage
and our site in Hiji was undamaged. We maintain earthquake insurance policies in Japan for limited coverage for property damage and
business interruption losses.
In 2011, we incurred cumulative gross operating losses of $101 million related to the earthquake and associated events in Japan.
These losses related to property damage, the underutilization expense we incurred from having our manufacturing assets only partially
loaded and costs associated with recovery teams assembled from across the world. Gross operating losses do not comprehend any
lost revenue.
These losses have been offset by $36 million in cumulative insurance proceeds related to property damage claims ($23 million
received in 2011 and $13 million for 2012). Almost all of these costs and proceeds are included in COR in our Consolidated statements
of income and are recorded in Other.
In addition, we recognized $172 million in cumulative insurance proceeds through December 31, 2012, ($135 million received
in 2012 and $37 million received in 2011) related to business interruption claims. These proceeds are recorded as revenue in our
Consolidated statements of income and in Other.
In the third quarter of 2012, we completed discussions with our insurers and their advisors, settling all associated claims against our
policies. All claims related to these events have been settled and the proceeds received.
5. Stock-based compensation
We have stock options outstanding to participants under various long-term incentive plans. We also have assumed stock options that
were granted by companies that we later acquired. Unless the options are acquisition-related replacement options, the option price
per share may not be less than 100 percent of the fair market value of our common stock on the date of the grant. Substantially all the
options have a ten-year term and vest ratably over four years. Our options generally continue to vest after the option recipient retires.
We also have RSUs outstanding under the long-term incentive plans. Each RSU represents the right to receive one share of TI
common stock on the vesting date, which is generally four years after the date of grant. Upon vesting, the shares are issued without
payment by the grantee. RSUs generally do not continue to vest after the recipient’s retirement date. Holders of most RSUs receive an
annual cash payment equal to the dividends paid on our common stock.
We have options and RSUs outstanding to non-employee directors under various director compensation plans. The plans generally
provide for annual grants of stock options and RSUs, a one-time grant of RSUs to each new non-employee director and the issuance of
TI common stock upon the distribution of stock units credited to deferred compensation accounts established for such directors.
We also have an employee stock purchase plan under which options are offered to all eligible employees in amounts based on a
percentage of the employee’s compensation, subject to a cap. Under the plan, the option price per share is 85 percent of the fair market
value on the exercise date, and options have a three-month term.
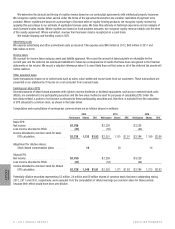
Total stock-based compensation expense recognized was as follows:
For Years Ended
December 31,
2012 2011 2010
Stock-based compensation expense recognized in:
Cost of revenue (COR) . . . . . . . . . . . . . . . . . . . . . . . . . . . . . . . . . . . . . . . . . . . $ 48 $ 40 $ 36
Research and development (R&D) . . . . . . . . . . . . . . . . . . . . . . . . . . . . . . . . . . . . . 71 58 53
Selling, general and administrative (SG&A) . . . . . . . . . . . . . . . . . . . . . . . . . . . . . . . . . 127 121 101
Acquisition charges . . . . . . . . . . . . . . . . . . . . . . . . . . . . . . . . . . . . . . . . . . . . 17 50 —
Total . . . . . . . . . . . . . . . . . . . . . . . . . . . . . . . . . . . . . . . . . . . . . . . . . . . . . . $263 $269 $190
These amounts include expense related to non-qualified stock options, RSUs and stock options offered under our employee stock
purchase plan and are net of expected forfeitures.
We issue awards of non-qualified stock options generally with graded vesting provisions (e.g., 25 percent per year for four years).
We recognize the related compensation cost on a straight-line basis over the minimum service period required for vesting of the award.
For awards to employees who are retirement eligible or nearing retirement eligibility, we recognize compensation cost on a straight-line
basis over the longer of the service period required to be performed by the employee in order to earn the award, or a six-month period.
Our RSUs generally vest four years after the date of grant. We recognize the related compensation costs on a straight-line basis over
the vesting period.