Tesco 2014 Annual Report Download - page 49
Download and view the complete annual report
Please find page 49 of the 2014 Tesco annual report below. You can navigate through the pages in the report by either clicking on the pages listed below, or by using the keyword search tool below to find specific information within the annual report.-
 1
1 -
2
-
3
-
4
-
5
-
6
-
7
-
8
-
9
-
10
-
11
-
12
-
13
-
14
-
15
-
16
-
17
-
18
-
19
-
20
-
21
-
22
-
23
-
24
-
25
-
26
-
27
-
28
-
29
-
30
-
31
-
32
-
33
-
34
-
35
-
36
-
37
-
38
-
 39
39 -
 40
40 -
 41
41 -
 42
42 -
 43
43 -
 44
44 -
 45
45 -
 46
46 -
 47
47 -
 48
48 -
 49
49 -
 50
50 -
 51
51 -
 52
52 -
 53
53 -
 54
54 -
 55
55 -
 56
56 -
 57
57 -
 58
58 -
 59
59 -
60
-
61
-
62
-
63
-
64
-
65
-
66
-
67
-
68
-
69
-
70
-
71
-
72
-
73
-
74
-
75
-
76
-
77
-
78
-
79
-
80
-
81
-
82
-
83
-
84
-
85
-
86
-
87
-
88
-
89
-
90
-
91
-
92
-
93
-
94
-
95
-
96
-
97
-
98
-
99
-
100
-
101
-
102
-
103
-
104
-
105
-
106
-
107
-
108
-
109
-
110
-
111
-
112
-
113
-
114
-
115
-
116
-
117
-
118
-
119
-
120
-
121
-
122
-
123
-
124
-
125
-
126
-
127
-
128
-
129
-
130
-
131
-
132
-
133
-
134
-
135
-
136
-
137
-
138
-
139
-
140
-
141
-
142
-
143
-
144
-
145
-
146
-
147
 |
 |

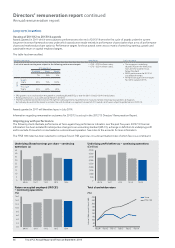
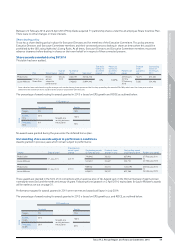
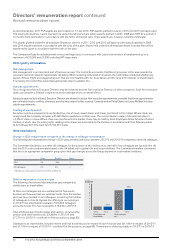
Underlying diluted earnings per share – continuing
operations (p)
Underlying profit before tax – continuing operations
(£million)
Return on capital employed (‘ROCE’)
− continuing operations
(%)
Total shareholder return
(%)
0
5
10
15
20
25
30
35
40
45
0
500
1,000
1,500
2,000
2,500
3,000
3,500
4,000
4,500
13/1412/1311/1210/1109/10
0.0
2.0
4.0
6.0
8.0
10.0
12.0
14.0
16.0
13/1412/1311/1210/1109/10 Feb 14Feb 13Feb 12Feb 11Feb 10Feb 09
FTSE 100
Tesco
Value of £100 invested 2 March 2009
09/1010/1111/12 12/13 13/14
240
220
200
180
160
140
120
100
80
60
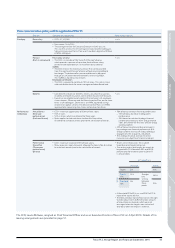
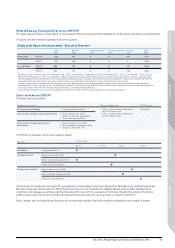
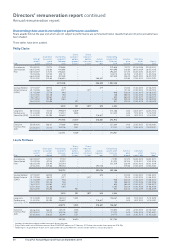
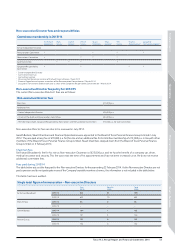
Long-term incentives
Vesting of 2011/12 to 2013/14 awards
Awards granted in 2011 which were subject to performance to the end of 2013/14 were the first cycle of awards under the current
long-term incentive framework to vest under which awards were made entirely in performance shares (rather than a mix of performance
shares and market value share options). Performance targets for these awards were set as a matrix of stretching earnings growth and
sustainable return on capital employed targets.
This table has been audited.
Performance targets Award level 2013/14 payout
% of initial awards vesting were subject to the following performance targets:
EPS growth p.a.
Threshold Target Stretch
7% 10% 12%
ROCE
Stretch
14·6% 45% 75% 100%
Threshold
13·6% 20% 60% 85%
• CEO – 275% of base salary.
• CFO – 225% of base salary.
• The increase in underlying
diluted EPS over the three years
from 2011/12 to 2013/14 was
below threshold.
• ROCE performance for 2013/14
was below threshold.
• Performance against these targets
has led to a payout of 0%.
• EPS growth is assessed based on the growth in underlying diluted EPS p.a. over the 2011/12 to 2013/14 financial years.
• ROCE performance is assessed based on ROCE in 2013/14.
• The Remuneration Committee reserves the right to make adjustments to performance measures to take into account acquisitions or disposals,
but will only do so when the impact is material. No such discretion was applied in respect of 2011 awards which were subject to performance in 2013/14.
Awards granted in 2011 will therefore lapse in July 2014.
Information regarding remuneration outcomes for 2012/13 is set out in the 2012/13 Directors’ Remuneration Report.
Aligning pay with performance
The following charts illustrate performance at Tesco against key performance indicators over the past five years. 2012/13 financial
information has been restated for retrospective changes to an accounting standard (IAS 19), a change in definition to underlying profit
and to exclude China which is now treated as a discontinued operation. See notes to the accounts for more information.
The FTSE 100 index has been selected to compare Tesco’s TSR against as it is a broad market index of which Tesco is a constituent.
46 Tesco PLC Annual Report and Financial Statements 2014
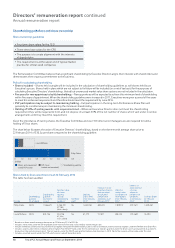
Directors’ remuneration report continued
Annual remuneration report