Tesco 2014 Annual Report Download - page 145
Download and view the complete annual report
Please find page 145 of the 2014 Tesco annual report below. You can navigate through the pages in the report by either clicking on the pages listed below, or by using the keyword search tool below to find specific information within the annual report.-
 1
1 -
2
-
3
-
4
-
5
-
6
-
7
-
8
-
9
-
10
-
11
-
12
-
13
-
14
-
15
-
16
-
17
-
18
-
19
-
20
-
21
-
22
-
23
-
24
-
25
-
26
-
27
-
28
-
29
-
30
-
31
-
32
-
33
-
34
-
35
-
36
-
37
-
38
-
39
-
40
-
41
-
42
-
43
-
44
-
45
-
46
-
47
-
48
-
49
-
50
-
51
-
52
-
53
-
54
-
55
-
56
-
57
-
58
-
59
-
60
-
61
-
62
-
63
-
64
-
65
-
66
-
67
-
68
-
69
-
70
-
71
-
72
-
73
-
74
-
75
-
76
-
77
-
78
-
79
-
80
-
81
-
82
-
83
-
84
-
85
-
86
-
87
-
88
-
89
-
90
-
91
-
92
-
93
-
94
-
95
-
96
-
97
-
98
-
99
-
100
-
101
-
102
-
103
-
104
-
105
-
106
-
107
-
108
-
109
-
110
-
111
-
112
-
113
-
114
-
115
-
116
-
117
-
118
-
119
-
120
-
121
-
122
-
123
-
124
-
125
-
126
-
127
-
128
-
129
-
130
-
131
-
132
-
133
-
134
-
 135
135 -
 136
136 -
 137
137 -
 138
138 -
 139
139 -
 140
140 -
 141
141 -
 142
142 -
 143
143 -
 144
144 -
 145
145 -
 146
146 -
 147
147
 |
 |

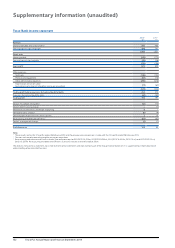
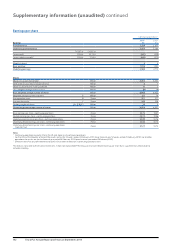
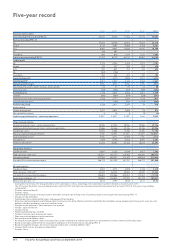
Continuing operations1
Earnings
20142
£m
20132
£m
Profit before tax 2,259 2,057
Underlying profit before tax 3,054 3,280
TY ERT % LY ERT %
Tax on profit315.36% 25.72% (347) (529)
Tax on underlying profit315.36% 17.44% (469) (572)
Minority interest 44
Basic earnings 1,916 1,532
Underlying earnings 2,589 2,712
Shares
Shares in issue at start of year Million 8,054 8,032
SAYE and Executive Share Option Schemes Million 87
Shares issued and own shares purchased Million 15 3
Less: weighted average shares in trust Million (9) (9)
Basic weighted average number of shares Million 8,068 8,033
Weighted average number of options AMillion 121 76
Average option price BPence 321 311
Average share price C Pence 349 328
Dilutory number of shares [A x (C-B)/C] Million 10 4
Diluted weighted average number of shares Million 8,078 8,037
Basic earnings per share – continuing operations Pence 23.75 19.07
Diluted earnings per share – continuing operations Pence 23.72 19.06
Underlying basic earnings per share – continuing operations Pence 32.09 33.76
Underlying diluted earnings per share – continuing operations Pence 32.05 33.74
Underlying diluted earnings per share – continuing operations
(constant tax) Pence 31. 27 33.74
Notes
1 Continuing operations excludes China, the US and Japan as discontinued operations.
2 For the UK and the Republic of Ireland the results are for the 52 weeks ended 22 February 2014 (prior financial year 52 weeks ended 23 February 2013). For all other
operations the results are for the financial year ended 28 February 2014 (prior financial year ended 28 February 2013).
3 Effective rate of tax on profit before tax for 2012/13 has been restated on a continuing operations basis.
The above is not a note to the financial statements. It does not replace Note 9 Earnings per share and diluted earnings per share but is supplementary information to
aid understanding.
Earnings per share
142 Tesco PLC Annual Report and Financial Statements 2014
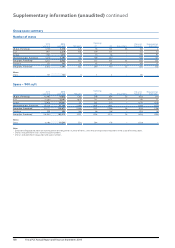
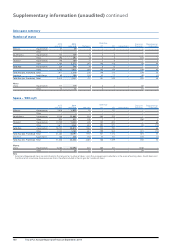
Supplementary information (unaudited) continued