Tesco 2009 Annual Report Download - page 72
Download and view the complete annual report
Please find page 72 of the 2009 Tesco annual report below. You can navigate through the pages in the report by either clicking on the pages listed below, or by using the keyword search tool below to find specific information within the annual report.-
 1
1 -
2
-
3
-
4
-
5
-
6
-
7
-
8
-
9
-
10
-
11
-
12
-
13
-
14
-
15
-
16
-
17
-
18
-
19
-
20
-
21
-
22
-
23
-
24
-
25
-
26
-
27
-
28
-
29
-
30
-
31
-
32
-
33
-
34
-
35
-
36
-
37
-
38
-
39
-
40
-
41
-
42
-
43
-
44
-
45
-
46
-
47
-
48
-
49
-
50
-
51
-
52
-
53
-
54
-
55
-
56
-
57
-
58
-
59
-
60
-
61
-
 62
62 -
 63
63 -
 64
64 -
 65
65 -
 66
66 -
 67
67 -
 68
68 -
 69
69 -
 70
70 -
 71
71 -
 72
72 -
 73
73 -
 74
74 -
 75
75 -
 76
76 -
 77
77 -
 78
78 -
 79
79 -
 80
80 -
 81
81 -
 82
82 -
83
-
84
-
85
-
86
-
87
-
88
-
89
-
90
-
91
-
92
-
93
-
94
-
95
-
96
-
97
-
98
-
99
-
100
-
101
-
102
-
103
-
104
-
105
-
106
-
107
-
108
-
109
-
110
-
111
-
112
-
113
-
114
-
115
-
116
-
117
-
118
-
119
-
120
-
121
-
122
-
123
-
124
-
125
-
126
-
127
-
128
-
129
-
130
-
131
-
132
-
133
-
134
-
135
-
136
-
137
-
138
-
139
-
140
 |
 |

70 FINANCIAL STATEMENTS
Tesco PLC Annual Report and Financial Statements 2009
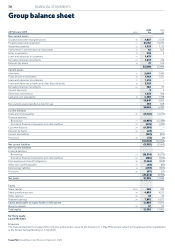
Group balance sheet
2009 2008
28 February 2009 notes £m £m
Non-current assets
Goodwill and other intangible assets 10 4,027 2,336
Property, plant and equipment 11 23,152 19,787
Investment property 12 1,539 1,112
Investments in joint ventures and associates 13 62 305
Other investments 14 259 4
Loans and advances to customers 17 1,470 –
Derivative financial instruments 22 1,478 216
Deferred tax assets 6 21 104
32,008 23,864
Current assets
Inventories
15 2,669 2,430
Trade and other receivables 16 1,798 1,311
Loans and advances to customers 17 1,918 –
Loans and advances to banks and other financial assets 18 2,129 –
Derivative financial instruments 22 382 97
Current tax assets 9 6
Short-term investments 1,233 360
Cash and cash equivalents 19 3,509 1,788
13,647 5,992
Non-current assets classified as held for sale 7 398 308
14,045 6,300
Current liabilities
Trade and other payables 20 (8,522) ( 7,277)
Financial liabilities
Borrowings 21 (4,059) (2,084)
Derivative financial instruments and other liabilities 22 (525) (443)
Customer deposits 24 (4,538) –
Deposits by banks 25 (24) –
Current tax liabilities (362) (455)
Provisions 26 (10) (4)
(18,040) (10,263)
Net current liabilities (3,995) (3,963)
Non-current liabilities
Financial liabilities
Borrowings 21 (12,391) (5,972)
Derivative financial instruments and other liabilities 22 (302) (322)
Post-employment benefit obligations 28 (1,494) (838)
Other non-current payables 20 (68) (42)
Deferred tax liabilities 6 (696) (802)
Provisions 26 (67) (23)
(15,018) (7,999)
Net assets 12,995 11,902
Equity
Share capital 29/30 395 393
Share premium account 30 4,638 4,511
Other reserves 30 40 40
Retained earnings 30 7,865 6,871
Equity attributable to equity holders of the parent 12,938 11, 815
Minority interests 30 57 87
Total equit y 12,995 11,902
Sir Terry Leahy
Laurie McIlwee
Directors
The financial statements on pages 68 to 123 were authorised for issue by the Directors on 1 May 2009 and are subject to the approval of the shareholders
at the Annual General Meeting on 3 July 2009.