Tesco 2001 Annual Report Download - page 5
Download and view the complete annual report
Please find page 5 of the 2001 Tesco annual report below. You can navigate through the pages in the report by either clicking on the pages listed below, or by using the keyword search tool below to find specific information within the annual report.-
 1
1 -
 2
2 -
 3
3 -
 4
4 -
 5
5 -
 6
6 -
 7
7 -
 8
8 -
 9
9 -
 10
10 -
 11
11 -
 12
12 -
 13
13 -
 14
14 -
 15
15 -
 16
16 -
17
-
18
-
19
-
20
-
21
-
22
-
23
-
24
-
25
-
26
-
27
-
28
-
29
-
30
-
31
-
32
-
33
-
34
-
35
-
36
-
37
-
38
-
39
-
40
-
41
-
42
-
43
-
44
 |
 |

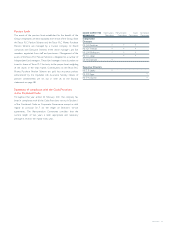
TESCO PLC 3
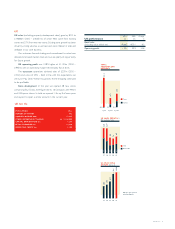
UK
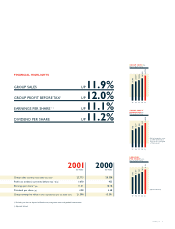
UK sales (excluding property development sales) grew by 8.5% to
£19,880m (2000 – £18,331m) of which 4.8% came from existing
stores and 3.7% from net new stores. Existing store growth has been
driven by strong volumes as we have seen zero inflation in total and
deflation in our core business.
Our customer focused strategy and commitment to value have
delivered increased market share and we see plenty of opportunity
for future growth.
UK operating profit was 10.8% higher at £1,100m (2000 –
£993m) with an operating margin held broadly flat at 6.0%.
The tesco.com operations achieved sales of £237m (2000 –
£52m) and a loss of £9m – both in line with the expectations we
set out in May 2000. Within this, grocery home shopping continued
to be profitable.
Store development In the year we opened 48 new stores
comprising four Extras, nine Superstores, 16 Compacts, one Metro
and 18 Express stores. In total we opened 1.3m sq ft of new space
and expect to open a similar amount in the current year.
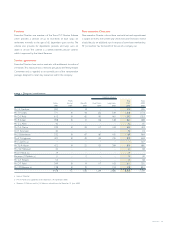
POPULATION 60m
NUMBER OF STORES 692
SQUARE FOOTAGE 000s 17,965
STORES OPENED/SQ FT ADDED 48 / 1,298,000
CAPITAL EXPENDITURE £m 1,206
RETAIL TURNOVER £m 19,880
OPERATING PROFIT £m 1,100
UK fact file
2001 2000 Change
UK performance £m £m %
Retail sales
(including value added tax) 19,880 18,331 8.5
Operating profit 1,100 993 10.8
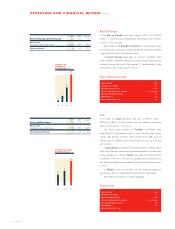
Tesco
market
TOTAL
SHAREHOLDER
RETURN %
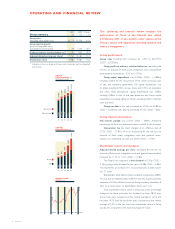
1 year 3 years 5 years
19.2
62.2
28.5
(0.2) 5.3 12.5
97 98 99 00 01
UK sales area opened
including Express
603
680
837
1,216
1,298
97 98 99 00 01
total
like-for-like
12.8
7.5
12.7*
6.1
8.0
4.0
7.4
4.2
8.5
4.8
UK SALES GROWTH %
*52 weeks pro forma
UK SALES AREA
OPENED 000 sq ft