Tesco 2001 Annual Report Download - page 4
Download and view the complete annual report
Please find page 4 of the 2001 Tesco annual report below. You can navigate through the pages in the report by either clicking on the pages listed below, or by using the keyword search tool below to find specific information within the annual report.-
 1
1 -
 2
2 -
 3
3 -
 4
4 -
 5
5 -
 6
6 -
 7
7 -
 8
8 -
 9
9 -
 10
10 -
 11
11 -
 12
12 -
 13
13 -
 14
14 -
 15
15 -
16
-
17
-
18
-
19
-
20
-
21
-
22
-
23
-
24
-
25
-
26
-
27
-
28
-
29
-
30
-
31
-
32
-
33
-
34
-
35
-
36
-
37
-
38
-
39
-
40
-
41
-
42
-
43
-
44
 |
 |
2TESCO PLC
OPERATING AND FINANCIAL REVIEW
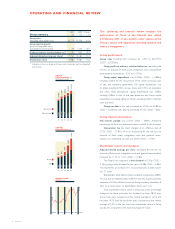
This operating and financial review analyses the
performance of Tesco in the financial year ended
24 February 2001. It also explains other aspects of the
Group’s results and operations including taxation and
treasury management.
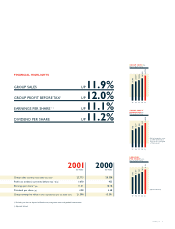
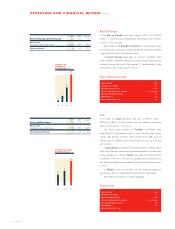
Group performance
Group sales including VAT increased by 11.9% to £22,773m
(2000 – £20,358m).
Group profit on ordinary activities before tax (excluding the
net loss on disposal of fixed assets, integration costs and goodwill
amortisation) increased by 12.0% to £1,070m.
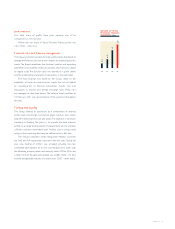
Group capital expenditure was £1,944m (2000 – £1,488m)
including £200m for the re-purchase of UK stores previously part
of sale and leaseback agreements. UK capital expenditure was
£1,206m, including £705m on new stores and £175m on extensions
and refits. Total international capital expenditure was £738m
including £390m in Asia. In the year ahead we see Group capital
expenditure increasing slightly to £2.0bn, including £200m of further
store buy-backs.
Group net debt in the year increased by £744m to £2,804m
(2000 – £2,060m), with gearing increasing to 52% (2000 – 43%).
Group interest and taxation
Net interest payable was £125m (2000 – £99m). Additional
borrowings to fund our investment plans resulted in this increase.
Corporation tax has been charged at an effective rate of
27.3% (2000 – 27.8%). Prior to accounting for the net loss on
disposal of fixed assets, integration costs and goodwill amor-
tisation, our underlying tax rate was 26.9% (2000 – 27.4%).
Shareholder returns and dividends
Adjusted diluted earnings per share (excluding the net loss on
disposal of fixed assets, integration costs and goodwill amortisation)
increased by 11.1% to 11.31p (2000 – 10.18p).
The Board has proposed a final dividend of 3.50p (2000 –
3.14p) giving a total dividend for the year of 4.98p (2000 – 4.48p).
This represents an increase of 11.2% and maintains dividend cover
at 2.27 times.
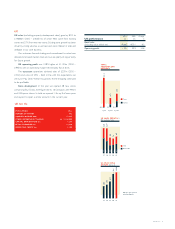
Shareholders’ funds, before minority interests, increased by £587m.
This was due to retained profits of £427m and new shares issued less
expenses of £162m, offset by losses on foreign currency translation of
£2m. As a result, return on shareholders’ funds was 21.1%.
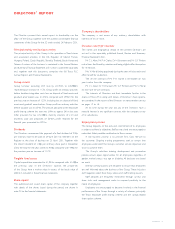
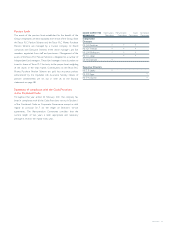
Total shareholder return, which is measured as the percentage
change in the share price plus the dividend, has been 28.5% over
the last five years, compared to the market average of 12.5% and
has been 19.2% over the last three years, compared to the market
average of 5.3%. In the last year, total shareholder return in Tesco
was 62.2% compared to the market average of (0.2)%.
2001 2000 Change
Group summary £m £m %
Group sales
(including value added tax) 22,773 20,358 11.9
Group operating profit
(prior to integration costs
and goodwill amortisation) 1,174 1,043 12.6
Profit on ordinary activities before tax†1,070 955 12.0
Adjusted diluted earnings per share†11.31p 10.18p 11.1
Dividend per share 4.98p 4.48p 11.2
†Excluding net loss on disposal of fixed assets, integration costs and goodwill
amortisation
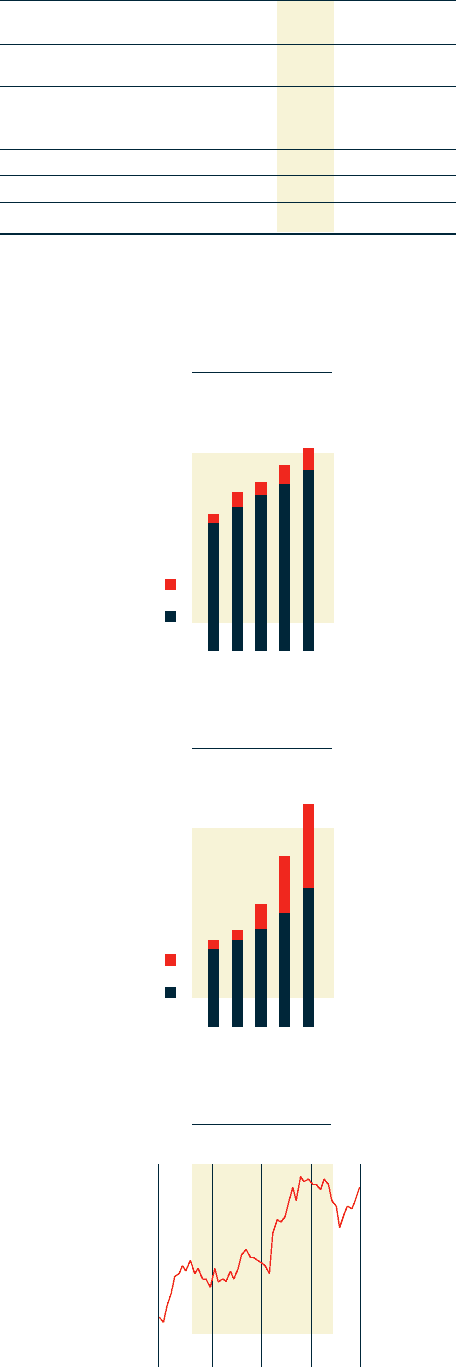
97 98 99 00
14,984
17,447*
18,546
20,358
01
22,773
GROUP
PERFORMANCE £m
*52 weeks pro forma
14,024
15,799*
17,070
18,331
19,880
Group sales
UK retail sales
97 98 99 00
841
1,067
1,488
01
1,944
CAPITAL
EXPENDITURE £m
682
757
848
989
1,206
Group
UK
758
Feb 01Dec 00Oct 00Jun 00Mar 00
169.0
271.0
TESCO SHARE
PRICE Pence