TD Bank 2006 Annual Report Download - page 4
Download and view the complete annual report
Please find page 4 of the 2006 TD Bank annual report below. You can navigate through the pages in the report by either clicking on the pages listed below, or by using the keyword search tool below to find specific information within the annual report.-
 1
1 -
 2
2 -
 3
3 -
 4
4 -
 5
5 -
 6
6 -
 7
7 -
 8
8 -
 9
9 -
 10
10 -
 11
11 -
 12
12 -
 13
13 -
 14
14 -
 15
15 -
16
-
17
-
18
-
19
-
20
-
21
-
22
-
23
-
24
-
25
-
26
-
27
-
28
-
29
-
30
-
31
-
32
-
33
-
34
-
35
-
36
-
37
-
38
-
39
-
40
-
41
-
42
-
43
-
44
-
45
-
46
-
47
-
48
-
49
-
50
-
51
-
52
-
53
-
54
-
55
-
56
-
57
-
58
-
59
-
60
-
61
-
62
-
63
-
64
-
65
-
66
-
67
-
68
-
69
-
70
-
71
-
72
-
73
-
74
-
75
-
76
-
77
-
78
-
79
-
80
-
81
-
82
-
83
-
84
-
85
-
86
-
87
-
88
-
89
-
90
-
91
-
92
-
93
-
94
-
95
-
96
-
97
-
98
-
99
-
100
-
101
-
102
-
103
-
104
-
105
-
106
-
107
-
108
-
109
-
110
-
111
-
112
-
113
-
114
-
115
-
116
-
117
-
118
-
119
-
120
-
121
-
122
-
123
-
124
-
125
-
126
-
127
-
128
-
129
-
130
 |
 |

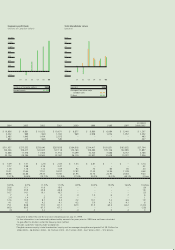
Economic profit (loss)
(millions of Canadian dollars)
01 02 03 04 05 06
$1,400
1,000
800
600
400
200
1,200
-200
0
Total shareholder return
(percent)
60%
50
40
20
10
-10
30
-20
0
01 02 03 04 05 06
(percent) 2006
Average of four other major
Canadian banks 22.7%
TD Bank 20.3%
(millions of Canadian dollars) 2006
Economic profit $1,309
inc./(dec.)
2004 2003 2002 2001 2000 1999 1998 1997 2006/2005
$10,656 $9,861 $10,072 $10,671 $ 9,877 $ 8,860 $ 6,084 $ 5,441 $ 1,207
2,232 989 (160) 1,300 969 2,938 1,076 1,057 2,352
2,485 1,945 1,414 2,075 – – – – 493
892 415 (160) 549 – – – – 247
$311,027 $273,532 $278,040 $287,838 $264,818 $214,417 $181,831 $163,852 $27,704
100,306 108,217 120,633 127,118 130,160 108,484 105,106 102,885 11,897
12,668 11,576 11,556 11,912 11,099 10,700 7,688 6,757 3,766
32,126 28,784 18,942 22,587 26,119 20,937 13,638 15,337 7,056
$ 3.39 $ 1.51 $ (.25) $ 2.05 $ 1.53 $ 4.81 $ – $ – $ 3.14
3.77 2.98 2.18 3.27 ––––.52
1.36 1.16 1.12 1.09 .92 .72 .66 .56 .20
19.31 17.64 17.91 18.97 17.83 17.25 12.94 11.38 4.48
48.98 43.86 29.35 35.94 41.95 33.75 22.95 25.83 9.40
15.1% 54.4% (15.7)% (11.9)% 27.4% 50.3% (9.0)% 69.1% 3.1bps
18.5% 8.7% (1.3)% 11.3% 8.9% 34.3% 15.0% 16.6% 10.2bps
20.6 17.1 11.6 18.0 – – – – (.9)
33.9 33.9 25.8 48.8 – – – – 1.8
16.7 14.1 10.1 16.3 –––– (.5)
.7 .3 – .4 .4 1.4 .6 .7 .6
2.4 1.4 .5 1.4 – – – – .1
12.6 10.5 8.1 8.4 7.2 10.1 7.2 6.6 1.9
4.1 4.2 4.2 4.1 4.2 5.0 4.2 4.1 .6
75.1 84.8 77.0 81.1 82.3 51.5 65.0 62.2 (14.3)
66.0 69.5 67.3 67.1 – – – – (2.8)
(.3) .2 2.2 .7 .4 .3 .5 .4 .3
2Adjusted to reflect the one-for-one stock dividend paid on July 31, 1999.
3As the information is not reasonably determinable, amounts for years prior to 1999 have not been calculated
to give effect to dilution under the treasury stock method.
4Includes customers’ liability under acceptances.
5Tangible common equity is total shareholders’ equity and less average intangibles and goodwill of $9.3 billion for
2006 (2005 – $6.8 billion; 2004 – $4.7 billion; 2003 – $5.7 billion; 2002 – $6.7 billion; 2001 – $7.3 billion).