TD Bank 2006 Annual Report Download - page 3
Download and view the complete annual report
Please find page 3 of the 2006 TD Bank annual report below. You can navigate through the pages in the report by either clicking on the pages listed below, or by using the keyword search tool below to find specific information within the annual report.-
 1
1 -
 2
2 -
 3
3 -
 4
4 -
 5
5 -
 6
6 -
 7
7 -
 8
8 -
 9
9 -
 10
10 -
 11
11 -
 12
12 -
 13
13 -
 14
14 -
15
-
16
-
17
-
18
-
19
-
20
-
21
-
22
-
23
-
24
-
25
-
26
-
27
-
28
-
29
-
30
-
31
-
32
-
33
-
34
-
35
-
36
-
37
-
38
-
39
-
40
-
41
-
42
-
43
-
44
-
45
-
46
-
47
-
48
-
49
-
50
-
51
-
52
-
53
-
54
-
55
-
56
-
57
-
58
-
59
-
60
-
61
-
62
-
63
-
64
-
65
-
66
-
67
-
68
-
69
-
70
-
71
-
72
-
73
-
74
-
75
-
76
-
77
-
78
-
79
-
80
-
81
-
82
-
83
-
84
-
85
-
86
-
87
-
88
-
89
-
90
-
91
-
92
-
93
-
94
-
95
-
96
-
97
-
98
-
99
-
100
-
101
-
102
-
103
-
104
-
105
-
106
-
107
-
108
-
109
-
110
-
111
-
112
-
113
-
114
-
115
-
116
-
117
-
118
-
119
-
120
-
121
-
122
-
123
-
124
-
125
-
126
-
127
-
128
-
129
-
130
 |
 |

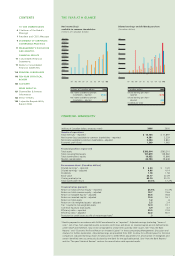
Net income (loss)
available to common shareholders
(millions of Canadian dollars)
97 98 99 00 01 02 03 04 05 06
$5,000
2,500
3,500
4,500
2,000
3,000
4,000
500
-500
1,000
1,500
0
Diluted earnings3and dividends per share
(Canadian dollars)
97 98 99 00 01 02 03 04 05 06
$7
4
3
6
5
1
-1
2
0
THE YEAR AT A GLANCE1
CONTENTS
TO OUR SHAREHOLDERS
6Chairman of the Board’s
Message
7President and CEO’s Message
9STATEMENT OF CORPORATE
GOVERNANCE PRACTICES
11 MANAGEMENT’S DISCUSSION
AND ANALYSIS
FINANCIAL RESULTS
71 Consolidated Financial
Statements
77 Notes to Consolidated
Financial Statements
114 PRINCIPAL SUBSIDIARIES
116 TEN-YEAR STATISTICAL
REVIEW
120 GLOSSARY
MORE ABOUT US
121 Shareholder & Investor
Information
122 Senior Officers
124 Corporate Responsibility
Report 2006
(Canadian dollars) 2006
Diluted earnings per share –
reported $6.34
Diluted earnings per share –
adjusted 4.66
Dividends per share 1.78
(millions of Canadian dollars) 2006
Net income available to common
shareholders – reported $4,581
Net income available to common
shareholders – adjusted 3,354
(millions of Canadian dollars, except as noted) 2006 2005
Results of operations
Total revenues – reported$13,104 $11,897
Net income (loss) available to common shareholders – reported 4,581 2,229
Net income available to common shareholders – adjusted 3,354 2,861
Economic profit (loss)1,309 1,062
Financial position at year end
Total assets $392,914 $365,210
Total risk-weighted assets 141,879 129,982
Total shareholders’ equity 19,632 15,866
Market capitalization 46,704 39,648
Per common share2(Canadian dollars)
Diluted earnings3– reported $ 6.34 $ 3.20
Diluted earnings – adjusted 4.66 4.14
Dividends 1.78 1.58
Book value 26.77 22.29
Closing market price 65.10 55.70
Total shareholder return 20.3% 17.2%
Financial ratios (percent)
Returnon total common equity – reported 25.5%15.3%
Return on total common equity – adjusted 18.7 19.6
Return on tangible equity5– adjusted 38.6 36.8
Returnon invested capital–adjusted 15.6 16.1
Return on total assets 1.2 .6
Return on risk-weighted assets – adjusted 2.5 2.4
Tier 1 capital to risk-weighted assets 12.0 10.1
Common equity to total assets 4.9 4.3
Efficiency ratio – reported 59.5 73.8
Efficiency ratio – adjusted 62.2 65.0
Provision for credit losses as a % of net average loans4.3 –
FINANCIAL HIGHLIGHTS1
1Results prepared in accordance with GAAP are referred to as “reported”. Adjusted earnings (excluding “items of
note”, net of tax, from reported results), economic profit (loss) and return on invested capital are not defined terms
under GAAP and therefore, may not be comparable to similar terms used by other issuers. See “How the Bank
Reports” and “Economic Profit and Return on Invested Capital” in the accompanying Management’s Discussion and
Analysis for further explanation. Adjusted earnings are presented from 2001 to allow for sufficient years for historical
comparison. Adjusted earnings shown for years prior to 2006 reflect adjustments for amortization of intangibles and
certain identified items as previously disclosed by the Bank for the applicable period. See “How the Bank Reports”
and the “Ten-year Statistical Review” sections for reconciliation with reported results.