TD Bank 2006 Annual Report Download - page 16
Download and view the complete annual report
Please find page 16 of the 2006 TD Bank annual report below. You can navigate through the pages in the report by either clicking on the pages listed below, or by using the keyword search tool below to find specific information within the annual report.-
 1
1 -
2
-
3
-
4
-
5
-
 6
6 -
 7
7 -
 8
8 -
 9
9 -
 10
10 -
 11
11 -
 12
12 -
 13
13 -
 14
14 -
 15
15 -
 16
16 -
 17
17 -
 18
18 -
 19
19 -
 20
20 -
 21
21 -
 22
22 -
 23
23 -
 24
24 -
 25
25 -
 26
26 -
27
-
28
-
29
-
30
-
31
-
32
-
33
-
34
-
35
-
36
-
37
-
38
-
39
-
40
-
41
-
42
-
43
-
44
-
45
-
46
-
47
-
48
-
49
-
50
-
51
-
52
-
53
-
54
-
55
-
56
-
57
-
58
-
59
-
60
-
61
-
62
-
63
-
64
-
65
-
66
-
67
-
68
-
69
-
70
-
71
-
72
-
73
-
74
-
75
-
76
-
77
-
78
-
79
-
80
-
81
-
82
-
83
-
84
-
85
-
86
-
87
-
88
-
89
-
90
-
91
-
92
-
93
-
94
-
95
-
96
-
97
-
98
-
99
-
100
-
101
-
102
-
103
-
104
-
105
-
106
-
107
-
108
-
109
-
110
-
111
-
112
-
113
-
114
-
115
-
116
-
117
-
118
-
119
-
120
-
121
-
122
-
123
-
124
-
125
-
126
-
127
-
128
-
129
-
130
 |
 |

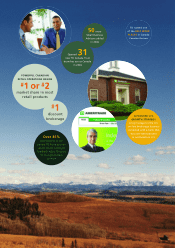
TD BANK FINANCIAL GROUP ANNUAL REPORT 2006 Management’s Discussion and Analysis
12
FINANCIAL RESULTS OVERVIEW
TD Bank Financial Group delivered exceptional
financial results in 2006. Each of our businesses
contributed to shareholder value.
CORPORATE OVERVIEW
TD Bank Financial Group (the Bank) is one of the largest financial
services providers in North America, offering comprehensive
retail and commercial banking, wealth management and whole-
sale banking products and services. The Bank’s operations and
activities are organized around operating groups: Canadian
Personal and Commercial Banking; U.S. Personal and
Commercial Banking; Wholesale Banking; and Wealth
Management. The U.S. Personal and Commercial Banking
segment was created from the acquisition of a majority stake
in TD Banknorth Inc. (TD Banknorth) in 2005.
HOW THE BANK REPORTS
The Bank prepares its financial statements in accordance with
Canadian generally accepted accounting principles (GAAP)
and refers to results prepared in accordance with GAAP as
the ”reported basis” or “reported”.
The Bank also utilizes “adjusted basis” or “adjusted” earnings
or net income to assess each of its businesses and to measure
overall Bank performance. To arrive at adjusted earnings, the
Bank removes items of note, net of income taxes, from reported
earnings. The items of note relate to items which management
does not believe are indicative of underlying business perform-
ance. The items of note are listed in Table 2. The items of note
include the Bank’s amortization of intangible assets, which
primarily relates to the TD Banknorth acquisition in 2005, the
acquisition of Hudson United Bancorp (Hudson) by TD Banknorth
in 2006 and the Canada Trust acquisition in 2000. The Bank
believes that adjusted earnings provides the reader with a better
understanding of how management views the Bank’s perform-
ance. As explained, adjusted earnings are different from reported
results determined in accordance with GAAP. Adjusted earnings,
items of note and related terms used in this MD&A are not
defined terms under GAAP, and, therefore, may not be compara-
ble to similar terms used by other issuers. Table 2 provides a
reconciliation between the Bank’s earnings and its reported
results and adjusted results.
(millions of Canadian dollars) 2006 2005 2004
Net interest income $6,371 $6,008 $ 5,773
Other income 6,733 5,889 4,883
Total revenues 13,104 11,897 10,656
Dilution gain, net 1,559 ––
Provision for credit losses (409) (55) 386
Non-interest expenses (8,727) (8,782) (8,007)
Income beforeprovision for income taxes, non-controlling interests in
subsidiaries and equity in net income of associated company 5,527 3,060 3,035
Provision for income taxes (874) (699) (803)
Non-controlling interests, net of income taxes (184) (132) –
Equity in net income of associated company, net of income taxes 134 ––
Net income – reported 4,603 2,229 2,232
Preferred dividends (22) ––
Net income available to common shareholders – reported $ 4,581 $ 2,229 $ 2,232
OPERATING RESULTS – REPORTED
TABLE 1