Sunoco 2008 Annual Report Download - page 11
Download and view the complete annual report
Please find page 11 of the 2008 Sunoco annual report below. You can navigate through the pages in the report by either clicking on the pages listed below, or by using the keyword search tool below to find specific information within the annual report.-
 1
1 -
 2
2 -
 3
3 -
 4
4 -
 5
5 -
 6
6 -
 7
7 -
 8
8 -
 9
9 -
 10
10 -
 11
11 -
 12
12 -
 13
13 -
 14
14 -
 15
15 -
 16
16 -
 17
17 -
 18
18 -
 19
19 -
 20
20 -
 21
21 -
 22
22 -
23
-
24
-
25
-
26
-
27
-
28
-
29
-
30
-
31
-
32
-
33
-
34
-
35
-
36
-
37
-
38
-
39
-
40
-
41
-
42
-
43
-
44
-
45
-
46
-
47
-
48
-
49
-
50
-
51
-
52
-
53
-
54
-
55
-
56
-
57
-
58
-
59
-
60
-
61
-
62
-
63
-
64
-
65
-
66
-
67
-
68
-
69
-
70
-
71
-
72
-
73
-
74
-
75
-
76
-
77
-
78
-
79
-
80
-
81
-
82
-
83
-
84
-
85
-
86
-
87
-
88
-
89
-
90
-
91
-
92
-
93
-
94
-
95
-
96
-
97
-
98
-
99
-
100
-
101
-
102
-
103
-
104
-
105
-
106
-
107
-
108
-
109
-
110
-
111
-
112
-
113
-
114
-
115
-
116
-
117
-
118
-
119
-
120
 |
 |

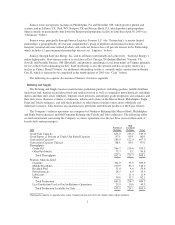
2007
Northeast
Refining
Mid-
Continent
Refining Total
Crude Unit Capacity* ....................................... 655.0 255.0 910.0
Crude Inputs as Percent of Crude Unit Rated Capacity ............. 93% 89% 92%
Conversion Capacity** ..................................... 285.0 122.0 407.0
Conversion Capacity Utilized ................................ 92% 100% 94%
Throughputs:
Crude Oil .............................................. 611.2 223.5 834.7
Other Feedstocks ........................................ 70.2 9.8 80.0
Total Throughputs ..................................... 681.4 233.3 914.7
Products Manufactured:
Gasoline ............................................... 326.4 112.8 439.2
Middle Distillates ........................................ 237.8 76.6 314.4
Residual Fuel ........................................... 62.2 4.4 66.6
Petrochemicals .......................................... 28.9 8.3 37.2
Lubricants .............................................. — 11.6 11.6
Other .................................................. 49.3 31.1 80.4
Total Production ....................................... 704.6 244.8 949.4
Less Production Used as Fuel in Refinery Operations ........... 32.1 11.3 43.4
Total Production Available for Sale ....................... 672.5 233.5 906.0
*Reflects a 10 thousand barrels-per-day increase in MidContinent Refining in July 2007 attributable to a crude unit debottleneck
project at the Toledo refinery.
**Reflects a 15 thousand barrels-per-day increase in Northeast Refining in May 2007 attributable to an expansion project at the
Philadelphia refinery.
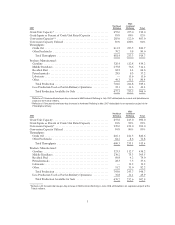
2006
Northeast
Refining
Mid-
Continent
Refining Total
Crude Unit Capacity ........................................ 655.0 245.0 900.0
Crude Inputs as Percent of Crude Unit Rated Capacity ............. 94% 92% 93%
Conversion Capacity* ...................................... 270.0 122.0 392.0
Conversion Capacity Utilized ................................ 94% 96% 95%
Throughputs:
Crude Oil .............................................. 616.1 224.5 840.6
Other Feedstocks ........................................ 64.2 8.6 72.8
Total Throughputs ..................................... 680.3 233.1 913.4
Products Manufactured:
Gasoline ............................................... 323.5 112.7 436.2
Middle Distillates ........................................ 230.2 75.3 305.5
Residual Fuel ........................................... 69.8 4.2 74.0
Petrochemicals .......................................... 28.3 7.3 35.6
Lubricants .............................................. — 13.2 13.2
Other .................................................. 51.2 31.0 82.2
Total Production ....................................... 703.0 243.7 946.7
Less Production Used as Fuel in Refinery Operations ........... 32.8 11.1 43.9
Total Production Available for Sale ....................... 670.2 232.6 902.8
*Reflects a 20 thousand barrels-per-day increase in MidContinent Refining in June 2006 attributable to an expansion project at the
Toledo refinery.
3