Sunbeam 2008 Annual Report Download - page 4
Download and view the complete annual report
Please find page 4 of the 2008 Sunbeam annual report below. You can navigate through the pages in the report by either clicking on the pages listed below, or by using the keyword search tool below to find specific information within the annual report.-
 1
1 -
 2
2 -
 3
3 -
 4
4 -
 5
5 -
 6
6 -
 7
7 -
 8
8 -
 9
9 -
 10
10 -
 11
11 -
 12
12 -
 13
13 -
 14
14 -
 15
15 -
16
-
17
-
18
-
19
-
20
-
21
-
22
-
23
-
24
-
25
-
26
-
27
-
28
-
29
-
30
-
31
-
32
-
33
-
34
-
35
-
36
-
37
-
38
-
39
-
40
-
41
-
42
-
43
-
44
-
45
-
46
-
47
-
48
-
49
-
50
-
51
-
52
-
53
-
54
-
55
-
56
-
57
-
58
-
59
-
60
-
61
-
62
-
63
-
64
-
65
-
66
-
67
-
68
-
69
-
70
-
71
-
72
-
73
-
74
-
75
-
76
 |
 |

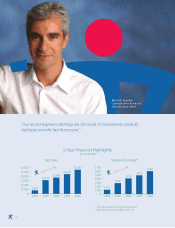
Martin E. Franklin
Chairman of the Board and
Chief Executive O cer
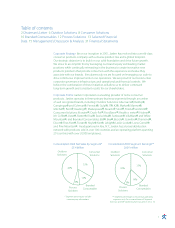
5-Year Financial Highlights
($ in millions)
* For a reconciliation of Segment Earnings to
GAAP Operating Earnings please see p. 14.
Net Sales
$6,000
$5,000
$4,000
$3,000
$2,000
$1,000
02004 2005 2006 2007 2008
-
-
-
-
-
-
CAGR = 59.2%
$5,383
$4,660
$3,846
$3,189
$839
Segment Earnings*
$700
$600
$500
$400
$300
$200
$100
02004 2005 2006 2007 2008
-
-
-
-
-
-
-
CAGR = 51.6%
$115
$298
$419
$502
$609
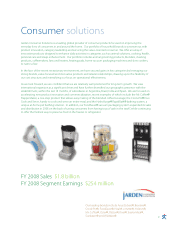
“Our record segment earnings are the result of investments carefully
deployed over the last three years.”
2