Sunbeam 2008 Annual Report Download - page 19
Download and view the complete annual report
Please find page 19 of the 2008 Sunbeam annual report below. You can navigate through the pages in the report by either clicking on the pages listed below, or by using the keyword search tool below to find specific information within the annual report.-
 1
1 -
2
-
3
-
4
-
5
-
6
-
7
-
8
-
 9
9 -
 10
10 -
 11
11 -
 12
12 -
 13
13 -
 14
14 -
 15
15 -
 16
16 -
 17
17 -
 18
18 -
 19
19 -
 20
20 -
 21
21 -
 22
22 -
 23
23 -
 24
24 -
 25
25 -
 26
26 -
 27
27 -
 28
28 -
 29
29 -
30
-
31
-
32
-
33
-
34
-
35
-
36
-
37
-
38
-
39
-
40
-
41
-
42
-
43
-
44
-
45
-
46
-
47
-
48
-
49
-
50
-
51
-
52
-
53
-
54
-
55
-
56
-
57
-
58
-
59
-
60
-
61
-
62
-
63
-
64
-
65
-
66
-
67
-
68
-
69
-
70
-
71
-
72
-
73
-
74
-
75
-
76
 |
 |

Results of Operations—Comparing 2008 to 2007
Net Sales
Years Ended December 31,
(In millions) 2008 2007
Outdoor Solutions $ 2,481.0 $ 1,698.6
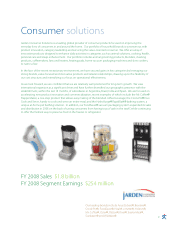
Consumer Solutions 1,812.9 1,869.2
Branded Consumables 804.9 806.2
Process Solutions 348.6 353.6
Intercompany eliminations (64.1) (67.5)
$ 5,383.3 $ 4,660.1
Net sales in 2008 increased $723 million or 16%, to $5.4 billion versus 2007. The overall increase in net sales was due to the acquisi-
tions of K2 and Pure Fishing, which are in the process of being integrated primarily into the Outdoor Solutions segment. Net sales in the
Outdoor Solutions segment increased $782 million, driven by the inclusion of the acquired K2 and Pure Fishing businesses. Net sales in the
legacyColeman business increased slightly primarily due to an expanded lighting program, the launch of new tailgating related products,
hurricane related volumes,favorable foreign currency translation and price increases, offset by declines in domestic and international sales
resulting from overall economic weakness. Net sales in the Consumer Solutions segment declined $56.3 million or 3.0%, primarily due to
weakness in domestic sales in most product categories, primarily as a result of overall economic weakness at retail, partially offset by
increased demand and improved pricing internationally (primarily Latin America). Net sales in the Branded Consumables segment were
essentially flat on a year-over-year basis, primarily due to improved sales of Ball®and Kerr®fresh preserving products, offset by overall weak-
ness at retail,primarily at domestic home improvement retailers. The Process Solutions segment declined 1.4% on a year-over-year basis,
primarily due to a reduction in the pass through pricing of zinc, primarily due to a 41% decline in the average price of zinc during 2008
versus 2007, partially offset by the inclusion of the K2 monofilament business.
Cost of sales increased $363 million to $3.9 billion for 2008 versus the same period in the prior year, primarily due to the acquisitions
of K2 and Pure Fishing, partially offset by the inclusion of a $119 million adjustment in 2007 related to the purchase accounting entry for the
elimination of manufacturer’s profit in inventory related to the K2 and Pure Fishing acquisitions. The fair value of the inventory acquired was
valued at the sales price of the finished inventory, less costs to complete and a reasonable profit allowance for selling effort. Cost of sales
as a percentage of net sales for 2008 and 2007 was 72.1% and 75.5%, respectively (72.9% for 2007 excluding the charge for the elimination
of manufacturer’s profit in inventory). The improvement is primarily due to the elimination of the manufacturer’s profit in inventory in 2007,
higher margins from acquired businesses, price increases and benefits from prior continuous improvement and integration programs,
partially offset by rising commodityand transportation costs.
Selling, general and administrative expenses increased $153 million to $1.0 billion for 2008 versus the same period in the prior year.
The increase was primarily due to the acquisitions of K2 and Pure Fishing, partially offset by an incremental decrease in stock-based com-
pensation expense in 2008 and an incremental decrease in pension and postretirement expense in 2008, primarily the result of the curtail-
ment and settlement of certain of the plans. At December 31, 2008, substantially all the domestic pension and postretirement plans are
frozen to new entrants and to future benefit accruals.
Reorganization and acquisition-related integration costs, net, increased $10.2 million to $59.8 million in 2008 versus the same period
in the prior year. The majority of these charges relate to ongoing integration-related activities in the Outdoor Solutions segment principally
as a result of the K2 and Pure Fishing acquisitions. During 2008, the Company also recorded reorganization and acquisition-related integra-
tion costs within the Branded Consumables and Process Solutions segments that primarily relate to the consolidation of manufacturing
facilities and headcount reductions. Additionally, for 2008, the Company recorded reorganization and acquisition-related integration costs
that are primarily due to severance and the integration of certain corporate functions related to the Acquisition. The 2007 reorganization
and acquisition-related integration costs related primarily to the Consumer Solutions segment; there were no such costs in 2008 as this
reorganization has been completed.
In the fourth quarter of 2008, the Company’s annual impairment test resulted in a non-cash charge of $283 million to reflect
impairment of goodwill and intangible assets. Of this charge, $172 million related to the impairment of goodwill in the Company’s Branded
Consumables and Outdoor Solutions segments. In the Branded Consumables segment the impairment charge was recorded within the
Firelog, Lehigh and United States Playing Cards reporting units. In the Outdoor Solutions segment the impairment charge was recorded
within the Apparel and Footwear reporting unit. The impairment for these reporting units was due to a decrease in the fair value of forecasted
cash flows, reflecting the continued deterioration of macroeconomic conditions, which accelerated and became apparent during the fourth
quarter of 2008 (hereafter referred to as “continued deterioration of macroeconomic conditions”).
Management’s Discussion and Analysis
Jarden Corporation Annual Report 2008
17