Sunbeam 2003 Annual Report Download - page 15
Download and view the complete annual report
Please find page 15 of the 2003 Sunbeam annual report below. You can navigate through the pages in the report by either clicking on the pages listed below, or by using the keyword search tool below to find specific information within the annual report.-
 1
1 -
2
-
3
-
4
-
 5
5 -
 6
6 -
 7
7 -
 8
8 -
 9
9 -
 10
10 -
 11
11 -
 12
12 -
 13
13 -
 14
14 -
 15
15 -
 16
16 -
 17
17 -
 18
18 -
 19
19 -
 20
20 -
 21
21 -
 22
22 -
 23
23 -
 24
24 -
 25
25 -
26
-
27
-
28
-
29
-
30
-
31
-
32
-
33
-
34
-
35
-
36
-
37
-
38
-
39
-
40
-
41
-
42
-
43
-
44
-
45
-
46
-
47
-
48
-
49
-
50
-
51
-
52
-
53
-
54
-
55
-
56
-
57
-
58
-
59
-
60
-
61
-
62
-
63
-
64
-
65
-
66
 |
 |
Jarden Corporation
Management’s Discussion and Analysis
The following “Overview” section is a brief summary of the significant issues addressed in Management’s
Discussion and Analysis of Financial Condition and Results of Operations (“MD&A”). Investors should read the
relevant sections of this MD&A for a complete discussion of the issues summarized below. The entire MD&A should
be read in conjunction with the Selected Financial Data and Financial Statements and Supplementary Data
appearing elsewhere in this Annual Report.
Overview
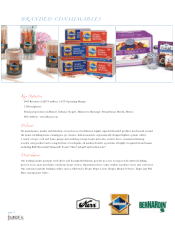
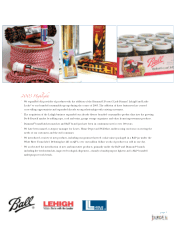
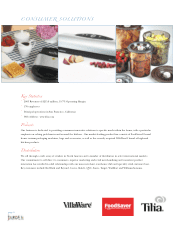
We are a leading provider of niche consumer products used in and around the home, under well-
known brand names including Ball®, Bernardin®, Crawford®, Diamond®, FoodSaver®, Forster®, Kerr®,
Lehigh®and Leslie-Locke®. In North America, we are the market leader in several consumer categories,
including plastic cutlery, home canning, home vacuum packaging, kitchen matches, rope, cord and
twine and toothpicks. We also manufacture zinc strip and a wide array of plastic products for third party
consumer product and medical companies as well as our own businesses.
Results of Operations
• Our net sales increased by $220.3 million or 60.0% over 2002;
• Our operating income increased by $6.3 million or 9.7% over 2002. Such increase was despite a
$21.8 million non-cash restricted stock charge in 2003. Excluding this non-cash restricted stock
charge our operating earnings increased by $28.2 million or 43.3% over 2002 (see “Non-GAAP
Measures” below);
• Our net income decreased by $4.5 million or 12.5% compared to 2002 and our diluted earning
per share was $0.33 or 19.6% lower than 2002. Our 2002 results were benefited by a net release
of a $4.4 million tax valuation allowance. Absent the 2003 non-cash restricted stock charge of
$21.8 million and related tax benefit and the 2002 tax valuation allowance, net income in 2003
would have been $45.1 million or 41.2% higher than net income of $31.9 million in 2002 and
diluted earning per share would have been $1.91 in 2003 compared to $1.48 in 2002 (see “Non-
GAAP Measures” below); and
• The increases to our net sales and our operating income discussed above, are principally the
result of acquisitions we completed in 2003 and 2002, which are described in “Acquisitions and
Disposition” Activities below. In addition, on an overall basis we had organic growth in 2003,
most notably at our consumer solutions segment where we grew net revenues over 10% on a
comparable basis to 2002.
Liquidity and Capital Resources
• We ended 2003 with a stronger balance sheet, as measured by net debt-to-total capitalization,
and improved liquidity, as measured by cash and cash equivalents on hand and availability
under our debt facility;
• Primarily through a $112.3 million equity offering, as well as our net income for the year we
increased total stockholders equity from $76.8 million at December 31, 2002 to $249.9 million at
December 31, 2003;
• Cash flow generated from operations was approximately $73.8 million in 2003 compared to
$69.6 million in December 31, 2002. The 2002 amount included tax refunds of $38.6 million.
Excluding the effect of the 2002 tax refunds, our cash flow from operations in 2003 was $42.8
million higher than 2002; and
page 13