Sunbeam 2003 Annual Report Download - page 12
Download and view the complete annual report
Please find page 12 of the 2003 Sunbeam annual report below. You can navigate through the pages in the report by either clicking on the pages listed below, or by using the keyword search tool below to find specific information within the annual report.-
 1
1 -
 2
2 -
 3
3 -
 4
4 -
 5
5 -
 6
6 -
 7
7 -
 8
8 -
 9
9 -
 10
10 -
 11
11 -
 12
12 -
 13
13 -
 14
14 -
 15
15 -
 16
16 -
 17
17 -
 18
18 -
 19
19 -
 20
20 -
 21
21 -
 22
22 -
23
-
24
-
25
-
26
-
27
-
28
-
29
-
30
-
31
-
32
-
33
-
34
-
35
-
36
-
37
-
38
-
39
-
40
-
41
-
42
-
43
-
44
-
45
-
46
-
47
-
48
-
49
-
50
-
51
-
52
-
53
-
54
-
55
-
56
-
57
-
58
-
59
-
60
-
61
-
62
-
63
-
64
-
65
-
66
 |
 |

Jarden Corporation
Selected Financial Data
The following tables set forth our selected financial data as of and for the years ended December 31,
2003, 2002, 2001, 2000 and 1999. The selected financial data set forth below has been derived from our
audited consolidated financial statements and related notes thereto where applicable for the respective
fiscal years. The selected financial data should be read in conjunction with “Management’s Discussion
and Analysis of Financial Condition and Results of Operations” as well as our consolidated financial
statements and notes thereto. These historical results are not necessarily indicative of the results to be
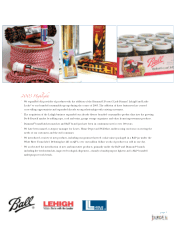
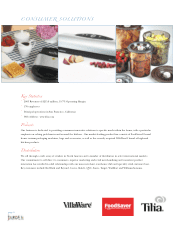
expected in the future. The results of the acquisitions of the businesses of Tilia International, Inc. and its
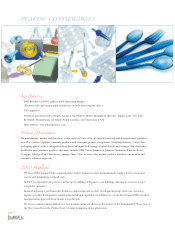
subsidiaries, Diamond Brands International Inc. and its subsidiaries and Lehigh Consumer Products
Corporation and its subsidiaries are included from April 1, 2002, February 1, 2003 and September 2,
2003, respectively.
For the year ended December 31,
2003
(a) (b)
2002
(c) (d)
2001
(e)
2000
(f)
1999
(g)
(in thousands, except per share data)
Statement of Operations Data:
Net sales ................................ $587,381 $367,104 $304,276 $356,123 $356,525
Costs and expenses:
Cost of sales .......................... 362,379 216,629 232,634 274,248 256,201
Selling, general and administrative
expenses .......................... 131,719 85,366 52,552 56,109 54,923
Restricted stock charge (k) ............. 21,833 — — — —
Goodwill amortization ................. — — 5,153 6,404 4,605
Special charges and reorganization
expenses (h) ....................... — — 4,978 380 2,314
Loss (gain) on divestiture of assets and
product lines ....................... — — 122,887 — (19,678)
Operating earnings (loss) .................. 71,450 65,109 (113,928) 18,982 58,160
Interest expense, net ...................... 19,184 12,611 11,791 11,917 8,395
Loss from early extinguishment of debt (i) . . . . — — — — 1,663
Income tax provision (benefit) .............. 20,488 16,189 (40,443) 2,402 18,823
Minority interest in gain (loss) of consolidated
subsidiary ............................. — — 153 (259) —
Income (loss) from continuing operations .... 31,778 36,309 (85,429) 4,922 29,279
Loss from discontinued operations .......... — — — — (87)
Net income (loss) ......................... $ 31,778 $ 36,309 $ (85,429) $ 4,922 $ 29,192
Basic earnings (loss) per share (j):
Income (loss) from continuing operations .... $ 1.40 $ 1.73 $ (4.47) $ 0.26 $ 1.45
Loss from discontinued operations .......... — — — — (.01)
$ 1.40 $ 1.73 $ (4.47) $ 0.26 $ 1.44
Diluted earnings (loss) per share (j):
Income (loss) from continuing operations .... $ 1.35 $ 1.68 $ (4.47) $ 0.26 $ 1.43
Loss from discontinued operations .......... — — — — (.01)
$ 1.35 $ 1.68 $ (4.47) $ 0.26 $ 1.42
Other Financial Data:
EBITDA (k) ............................. $ 86,495 $ 75,110 $ (95,284) $ 40,552 $ 74,194
Cash flows from operations (l) .............. 73,798 69,551 39,857 19,144 22,324
Depreciation and amortization .............. 15,045 10,001 18,797 21,311 17,697
Capital expenditures ...................... 12,822 9,277 9,707 13,637 16,628
page 10