Starwood 2012 Annual Report Download - page 134
Download and view the complete annual report
Please find page 134 of the 2012 Starwood annual report below. You can navigate through the pages in the report by either clicking on the pages listed below, or by using the keyword search tool below to find specific information within the annual report.-
 1
1 -
2
-
3
-
4
-
5
-
6
-
7
-
8
-
9
-
10
-
11
-
12
-
13
-
14
-
15
-
16
-
17
-
18
-
19
-
20
-
21
-
22
-
23
-
24
-
25
-
26
-
27
-
28
-
29
-
30
-
31
-
32
-
33
-
34
-
35
-
36
-
37
-
38
-
39
-
40
-
41
-
42
-
43
-
44
-
45
-
46
-
47
-
48
-
49
-
50
-
51
-
52
-
53
-
54
-
55
-
56
-
57
-
58
-
59
-
60
-
61
-
62
-
63
-
64
-
65
-
66
-
67
-
68
-
69
-
70
-
71
-
72
-
73
-
74
-
75
-
76
-
77
-
78
-
79
-
80
-
81
-
82
-
83
-
84
-
85
-
86
-
87
-
88
-
89
-
90
-
91
-
92
-
93
-
94
-
95
-
96
-
97
-
98
-
99
-
100
-
101
-
102
-
103
-
104
-
105
-
106
-
107
-
108
-
109
-
110
-
111
-
112
-
113
-
114
-
115
-
116
-
117
-
118
-
119
-
120
-
121
-
122
-
123
-
 124
124 -
 125
125 -
 126
126 -
 127
127 -
 128
128 -
 129
129 -
 130
130 -
 131
131 -
 132
132 -
 133
133 -
 134
134 -
 135
135 -
 136
136 -
 137
137 -
 138
138 -
 139
139 -
 140
140 -
 141
141 -
 142
142 -
 143
143 -
 144
144 -
145
-
146
-
147
-
148
-
149
-
150
-
151
-
152
-
153
-
154
-
155
-
156
-
157
-
158
-
159
-
160
-
161
-
162
-
163
-
164
-
165
-
166
-
167
-
168
-
169
-
170
-
171
-
172
-
173
-
174
-
175
-
176
-
177
-
178
-
179
-
180
-
181
-
182
-
183
-
184
-
185
-
186
-
187
-
188
-
189
-
190
-
191
-
192
-
193
-
194
-
195
-
196
-
197
-
198
-
199
-
200
-
201
-
202
-
203
-
204
-
205
-
206
-
207
-
208
-
209
-
210
 |
 |

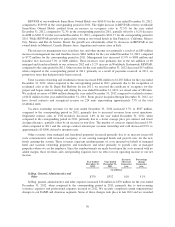
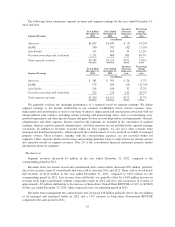
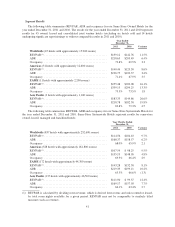
The following tables summarize segment revenues and segment earnings for the year ended December 31,
2012 and 2011.
Segment Revenues
Year Ended
December 31,
2012
Year Ended
December 31,
2011
Increase /
(decrease)
from prior
year
Percentage
change
from prior
year
(in millions)
Americas ............................. $1,627 $1,630 $ (3) (0.2)%
EAME ................................ 550 592 (42) (7.1)%
Asia Pacific ........................... 337 303 34 11.2%
Vacation ownership and residential ........ 1,271 688 583 84.7%
Total segment revenues .................. $3,785 $3,213 $572 17.8%
Segment Earnings
Year Ended
December 31,
2012
Year Ended
December 31,
2011
Increase /
(decrease)
from prior
year
Percentage
change
from prior
year
(in millions)
Americas ............................. $ 581 $ 555 $ 26 4.7%
EAME ................................ 179 204 (25) (12.3)%
Asia Pacific ........................... 218 186 32 17.2%
Vacation ownership and residential ........ 312 170 142 83.5%
Total segment earnings .................. $1,290 $1,115 $175 15.7%
We primarily evaluate the operating performance of a segment based on segment earnings. We define
segment earnings as net income attributable to our common stockholders before interest expense, taxes,
depreciation and amortization, as well as our share of interest, depreciation and amortization associated with our
unconsolidated joint ventures, excluding certain recurring and nonrecurring items, such as restructuring costs,
goodwill impairment and other special charges and gains (losses) on asset dispositions and impairments. General,
administrative and other expenses directly related to the segments are included in the calculation of segment
earnings, whereas corporate general, administrative, and other expenses are not included in the segment earnings
calculation. In addition to revenues recorded within our four segments, we also have other revenues from
managed and franchised properties, which represent the reimbursement of costs incurred on behalf of managed
property owners. These revenues, together with the corresponding expenses, are not recorded within our
segments. Other corporate unallocated revenues and earnings primarily relate to other license fee income and are
also reported outside of segment revenues. Note 26 to the consolidated financial statements presents further
information about our segments.
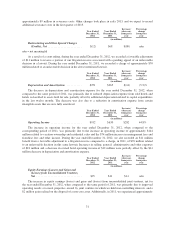
The Americas
Segment revenues decreased $3 million in the year ended December 31, 2012, compared to the
corresponding period in 2011.
Revenues from our owned, leased and consolidated joint venture hotels decreased $38 million, primarily
due to lost revenues from 10 owned hotels that were sold or closed in 2011 and 2012. These sold or closed hotels
had revenues of $114 million in the year ended December 31, 2012, compared to $209 million for the
corresponding period in 2011. Lost revenue from sold hotels was partially offset by a $48 million increase in
revenues from eight owned hotels without comparable results in 2012 and 2011 and an increase in revenue of
approximately $9 million attributable to the increase in Same-Store Owned Hotel REVPAR of 2.0% to $138.06
for the year ended December 31, 2012, when compared to the corresponding period in 2011.
Revenues from management fees and franchise fees increased $38 million primarily due to the net addition
of 16 managed and franchised hotels in 2012 and a 5.8% increase in Same-Store Systemwide REVPAR
compared to the same period in 2011.
35