Starwood 2012 Annual Report Download - page 121
Download and view the complete annual report
Please find page 121 of the 2012 Starwood annual report below. You can navigate through the pages in the report by either clicking on the pages listed below, or by using the keyword search tool below to find specific information within the annual report.-
 1
1 -
2
-
3
-
4
-
5
-
6
-
7
-
8
-
9
-
10
-
11
-
12
-
13
-
14
-
15
-
16
-
17
-
18
-
19
-
20
-
21
-
22
-
23
-
24
-
25
-
26
-
27
-
28
-
29
-
30
-
31
-
32
-
33
-
34
-
35
-
36
-
37
-
38
-
39
-
40
-
41
-
42
-
43
-
44
-
45
-
46
-
47
-
48
-
49
-
50
-
51
-
52
-
53
-
54
-
55
-
56
-
57
-
58
-
59
-
60
-
61
-
62
-
63
-
64
-
65
-
66
-
67
-
68
-
69
-
70
-
71
-
72
-
73
-
74
-
75
-
76
-
77
-
78
-
79
-
80
-
81
-
82
-
83
-
84
-
85
-
86
-
87
-
88
-
89
-
90
-
91
-
92
-
93
-
94
-
95
-
96
-
97
-
98
-
99
-
100
-
101
-
102
-
103
-
104
-
105
-
106
-
107
-
108
-
109
-
110
-
 111
111 -
 112
112 -
 113
113 -
 114
114 -
 115
115 -
 116
116 -
 117
117 -
 118
118 -
 119
119 -
 120
120 -
 121
121 -
 122
122 -
 123
123 -
 124
124 -
 125
125 -
 126
126 -
 127
127 -
 128
128 -
 129
129 -
 130
130 -
 131
131 -
132
-
133
-
134
-
135
-
136
-
137
-
138
-
139
-
140
-
141
-
142
-
143
-
144
-
145
-
146
-
147
-
148
-
149
-
150
-
151
-
152
-
153
-
154
-
155
-
156
-
157
-
158
-
159
-
160
-
161
-
162
-
163
-
164
-
165
-
166
-
167
-
168
-
169
-
170
-
171
-
172
-
173
-
174
-
175
-
176
-
177
-
178
-
179
-
180
-
181
-
182
-
183
-
184
-
185
-
186
-
187
-
188
-
189
-
190
-
191
-
192
-
193
-
194
-
195
-
196
-
197
-
198
-
199
-
200
-
201
-
202
-
203
-
204
-
205
-
206
-
207
-
208
-
209
-
210
 |
 |

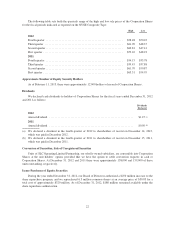
The following table sets forth the quarterly range of the high and low sale prices of the Corporation Shares
for the fiscal periods indicated as reported on the NYSE Composite Tape:
High Low
2012
Fourth quarter ...................................................... $58.48 $50.22
Third quarter ....................................................... $61.09 $48.37
Second quarter ...................................................... $60.81 $47.41
First quarter ........................................................ $59.10 $48.23
2011
Fourth quarter ...................................................... $54.15 $35.78
Third quarter ....................................................... $59.45 $37.88
Second quarter ...................................................... $61.70 $50.87
First quarter ........................................................ $65.51 $54.95
Approximate Number of Equity Security Holders
As of February 11, 2013, there were approximately 12,000 holders of record of Corporation Shares.
Dividends
We declared cash dividends to holders of Corporation Shares for the fiscal years ended December 31, 2012
and 2011 as follows:
Dividends
Declared
2012
Annual dividend ........................................................... $1.25 (a)
2011
Annual dividend ........................................................... $0.50 (b)
(a) We declared a dividend in the fourth quarter of 2012 to shareholders of record on December 14, 2012,
which was paid in December 2012.
(b) We declared a dividend in the fourth quarter of 2011 to shareholders of record on December 15, 2011,
which was paid in December 2011.
Conversion of Securities; Sale of Unregistered Securities
Units of SLC Operating Limited Partnership, our wholly-owned subsidiary, are convertible into Corporation
Shares at the unit holders’ option, provided that we have the option to settle conversion requests in cash or
Corporation Shares. At December 31, 2012 and 2011 there were approximately 158,000 and 159,000 of these
units outstanding, respectively.
Issuer Purchases of Equity Securities
During the year ended December 31, 2012, our Board of Directors authorized a $250 million increase to the
share repurchase program, and we repurchased 6.3 million common shares at an average price of $50.83 for a
total cost of approximately $320 million. As of December 31, 2012, $180 million remained available under the
share repurchase authorization.
22