Starwood 2012 Annual Report Download - page 127
Download and view the complete annual report
Please find page 127 of the 2012 Starwood annual report below. You can navigate through the pages in the report by either clicking on the pages listed below, or by using the keyword search tool below to find specific information within the annual report.-
 1
1 -
2
-
3
-
4
-
5
-
6
-
7
-
8
-
9
-
10
-
11
-
12
-
13
-
14
-
15
-
16
-
17
-
18
-
19
-
20
-
21
-
22
-
23
-
24
-
25
-
26
-
27
-
28
-
29
-
30
-
31
-
32
-
33
-
34
-
35
-
36
-
37
-
38
-
39
-
40
-
41
-
42
-
43
-
44
-
45
-
46
-
47
-
48
-
49
-
50
-
51
-
52
-
53
-
54
-
55
-
56
-
57
-
58
-
59
-
60
-
61
-
62
-
63
-
64
-
65
-
66
-
67
-
68
-
69
-
70
-
71
-
72
-
73
-
74
-
75
-
76
-
77
-
78
-
79
-
80
-
81
-
82
-
83
-
84
-
85
-
86
-
87
-
88
-
89
-
90
-
91
-
92
-
93
-
94
-
95
-
96
-
97
-
98
-
99
-
100
-
101
-
102
-
103
-
104
-
105
-
106
-
107
-
108
-
109
-
110
-
111
-
112
-
113
-
114
-
115
-
116
-
 117
117 -
 118
118 -
 119
119 -
 120
120 -
 121
121 -
 122
122 -
 123
123 -
 124
124 -
 125
125 -
 126
126 -
 127
127 -
 128
128 -
 129
129 -
 130
130 -
 131
131 -
 132
132 -
 133
133 -
 134
134 -
 135
135 -
 136
136 -
 137
137 -
138
-
139
-
140
-
141
-
142
-
143
-
144
-
145
-
146
-
147
-
148
-
149
-
150
-
151
-
152
-
153
-
154
-
155
-
156
-
157
-
158
-
159
-
160
-
161
-
162
-
163
-
164
-
165
-
166
-
167
-
168
-
169
-
170
-
171
-
172
-
173
-
174
-
175
-
176
-
177
-
178
-
179
-
180
-
181
-
182
-
183
-
184
-
185
-
186
-
187
-
188
-
189
-
190
-
191
-
192
-
193
-
194
-
195
-
196
-
197
-
198
-
199
-
200
-
201
-
202
-
203
-
204
-
205
-
206
-
207
-
208
-
209
-
210
 |
 |
Deferred tax assets and liabilities are measured using enacted tax rates in effect for the year in which those
temporary differences are expected to be recovered or settled. The effect on deferred tax assets and liabilities of a
change in tax rates is recognized in earnings in the period when the new rate is enacted. Deferred tax assets are
evaluated for future realization and reduced by a valuation allowance to the extent we believe a portion will not
be realized. We consider many factors when assessing the likelihood of future realization of our deferred tax
assets, including our recent cumulative earnings experience and expectations of future available taxable income
by taxing jurisdiction, the carry-back and carry-forward periods available to us for tax reporting purposes and tax
attributes.
We measure and recognize the amount of tax benefit that should be recorded for financial statement
purposes for uncertain tax positions taken or expected to be taken in a tax return. With respect to uncertain tax
positions, we evaluate the recognized tax benefits for derecognition, classification, interest and penalties, interim
period accounting and disclosure requirements. Judgment is required in assessing the future tax consequences of
events that have been recognized in our financial statements or tax returns.
RESULTS OF OPERATIONS
The following discussion presents an analysis of results of our operations for the years ended December 31,
2012, 2011 and 2010.
Results for the year ended December 31, 2012 were strong. We performed well along all four key drivers of
value. We held our costs in check for the fourth year in a row, grew our footprint with quality hotels and
contracts, sustained high REVPAR and occupancies in an uncertain environment, and we realized significant
value from real estate sales. Our results for the year ended December 31, 2012 benefited from the sales of
residential units at the St. Regis Bal Harbour. During 2012, we closed sales of 188 units and realized revenues of
$684 million. From project inception through December 31, 2012, we have closed contracts and recognized
revenue on 224 units representing approximately 73% of the total residential units.
The uncertainty we saw in major world economies is showing signs of giving way to stronger demand
growth. Beyond next year into the foreseeable future, we are bullish about the long-term outlook on the global
high-end lodging industry. We are poised to benefit from higher rates in North America and Europe where
demand is growing but supply is already limited. Even more importantly, the dramatic economic growth in Asia,
Latin America, Middle East and Africa is fueling demand for our brands worldwide.
We remain optimistic that the strength of our brands will continue to drive strong operating results. We
believe that we have the highest quality pipeline in the industry, as measured by percentage growth potential as
well as our focus on valuable management contracts in the upscale and luxury segments. At December 31, 2012,
the Company had approximately 400 hotels in the active pipeline representing approximately 100,000 rooms. Of
these rooms, 67% are in the upscale and luxury segments and 85% are outside of North America. During 2012,
we signed 131 hotel management and franchise contracts (representing approximately 30,500 rooms). Also,
during 2012, 69 new hotels and resorts (representing approximately 17,600 rooms) entered the system and 25
properties (representing approximately 5,500 rooms) exited the system.
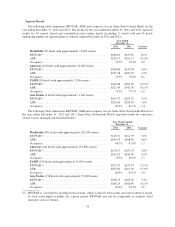
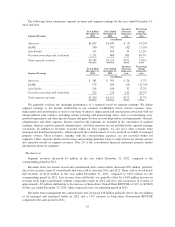
An indicator of the performance of our owned, leased and consolidated joint venture hotels, as well as our
managed and franchised hotels, is REVPAR, as it measures the period-over-period change in rooms’ revenue for
comparable properties. Along with REVPAR, we also evaluate our hotels by measuring the change in Average
Daily Rate (“ADR”) and occupancy. This is particularly the case in the United States, where there is no impact
on this measure from foreign currency exchange rates.
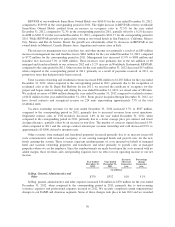
We continually update and renovate our owned, leased and consolidated joint venture hotels and include
these hotels in our Same-Store Owned Hotel results. We also undertake major repositionings of hotels. While
undergoing major repositionings, hotels are generally not operating at full capacity and, as such, these
repositionings can negatively impact our hotel revenues and are not included in Same-Store Owned Hotel results.
28