Sonic 2011 Annual Report Download - page 3
Download and view the complete annual report
Please find page 3 of the 2011 Sonic annual report below. You can navigate through the pages in the report by either clicking on the pages listed below, or by using the keyword search tool below to find specific information within the annual report.-
 1
1 -
 2
2 -
 3
3 -
 4
4 -
 5
5 -
 6
6 -
 7
7 -
 8
8 -
 9
9 -
 10
10 -
 11
11 -
 12
12 -
 13
13 -
 14
14 -
15
-
16
-
17
-
18
-
19
-
20
-
21
-
22
-
23
-
24
-
25
-
26
-
27
-
28
-
29
-
30
-
31
-
32
-
33
-
34
-
35
-
36
-
37
-
38
-
39
-
40
-
41
-
42
-
43
-
44
-
45
-
46
-
47
-
48
-
49
-
50
-
51
-
52
-
53
-
54
-
55
-
56
-
57
-
58
-
59
-
60
 |
 |

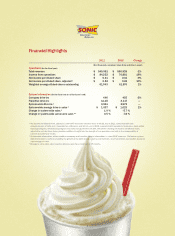
Financial Highlights
2011 2010 Change
($ in thousands, except per share data and drive-in count)
Operations (for the fiscal year)
Total revenues $ 545,951 $ 550,926 -1%
Income from operations $ 84,253 $ 70,881 19%
Net income per diluted share $ 0.31 $ 0.34 -9%
Net income per diluted share, adjusted 1$ 0.53 $ 0.48 10%
Weighted average diluted shares outstanding 61,943 61,576 1%
System Information (for the fiscal year or at fiscal year’s end)
Company drive-ins 446 455 -2%
Franchise drive-ins 3,115 3,117 —
System-wide drive-ins 23,561 3,572 —
System-wide average drive-in sales 2$ 1,037 $ 1,023 1%
Change in system-wide sales 21.9 % -5.7 %
Change in system-wide same-store sales 2,3 0.5 % -7.8 %
1