Sonic 2011 Annual Report Download - page 19
Download and view the complete annual report
Please find page 19 of the 2011 Sonic annual report below. You can navigate through the pages in the report by either clicking on the pages listed below, or by using the keyword search tool below to find specific information within the annual report.-
 1
1 -
2
-
3
-
4
-
5
-
6
-
7
-
8
-
 9
9 -
 10
10 -
 11
11 -
 12
12 -
 13
13 -
 14
14 -
 15
15 -
 16
16 -
 17
17 -
 18
18 -
 19
19 -
 20
20 -
 21
21 -
 22
22 -
 23
23 -
 24
24 -
 25
25 -
 26
26 -
 27
27 -
 28
28 -
 29
29 -
30
-
31
-
32
-
33
-
34
-
35
-
36
-
37
-
38
-
39
-
40
-
41
-
42
-
43
-
44
-
45
-
46
-
47
-
48
-
49
-
50
-
51
-
52
-
53
-
54
-
55
-
56
-
57
-
58
-
59
-
60
 |
 |

Overview
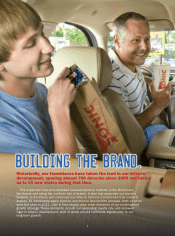
Description of the Business. Sonic operates and franchises the largest chain of drive-in restaurants in the United
States. As of August 31, 2011, the Sonic system was comprised of 3,561 drive-ins, of which 13% were Company Drive-
Ins and 87% were Franchise Drive-Ins. Sonic Drive-Ins feature signature menu items such as specialty drinks including
cherry limeades and slushes, ice cream desserts, made-to-order sandwiches and hamburgers, six-inch premium beef hot
dogs, footlong quarter pound chili cheese coneys, hand-battered onion rings, tater tots, and a unique breakfast menu. We
derive our revenues primarily from Company Drive-In sales and royalties from franchisees. We also receive revenues from
leasing real estate to franchisees, initial franchise fees, earnings from minority investments in franchise operations and
other miscellaneous revenues.
Costs of Company Drive-In sales relate directly to Company Drive-In sales. Other expenses, such as depreciation,
amortization, and general and administrative expenses, relate to our franchising operations, as well as Company Drive-In
operations. Our revenues and expenses are directly affected by the number and sales volumes of Company Drive-Ins. Our
revenues and, to a lesser extent, expenses also are affected by the number and sales volumes of Franchise Drive-Ins.
Initial franchise fees and franchise royalties are directly affected by the number of Franchise Drive-In openings. Lease
revenues are generated by leasing of land and buildings for Company Drive-Ins that have been sold to franchisees.
Overview of Business Performance. Sales momentum for fiscal year 2011 showed improvement, highlighted by positive
same-store sales, particularly during the third fiscal quarter. System-wide same-store sales increased 0.5% during fiscal
year 2011 as compared to a decline of 7.8% for fiscal year 2010. Same-store sales at Company Drive-Ins increased by 1.8%
during fiscal year 2011 as compared to a decline of 8.8% for fiscal year 2010. We believe these results reflect the positive
impact of the initiatives implemented in fiscal year 2010, including product quality improvements made over the past two
years and a greater emphasis on personalized service with skating carhops. We also believe these results reflect a slightly
improving economy. Positive system-wide same-store sales drive other aspects of our multi-layered growth strategy, such
as our ascending royalty rate and increased operating cash flows. Net income and diluted earnings per share for fiscal year
2011 were $19.2 million and $0.31, respectively, as compared to net income of $21.2 million or $0.34 per diluted share
for fiscal year 2010. Excluding an after-tax net loss of $14.4 million from the early extinguishment of debt during fiscal
year 2011 and a $1.1 million tax benefit recognized during the first quarter of fiscal year 2011, net income and diluted
earnings per share for fiscal year 2011 were $32.6 million and $0.53, respectively.
Franchisees opened 40 new drive-ins and relocated or rebuilt 11 existing drive-ins during the fiscal year. While the
number of new drive-in openings in fiscal year 2011 was down compared to the prior year, investments by franchisees in
new and existing locations continued throughout the year. We also continued our expansion in several new markets.
The growth and success of our business is built around implementation of our brand strategy, which features the
following components:
• Improved performance of Company Drive-Ins, including consistent and improved operations execution, improved
speed of service, cleanliness of drive-ins, and focus on the customer experience; and
• Same-store sales growth fueled by re-emphasizing our core brand strengths, including high-quality products, new
products and service differentiation with skating carhops.
The following non-GAAP adjustments are intended to supplement the presentation of the company’s financial results
in accordance with GAAP. We believe the exclusion of these items in evaluating the change in net income and diluted
earnings per share for the periods below provides useful information to investors and management regarding the underlying
business trends and the performance of our ongoing operations and is helpful for period-to-period and company-to-company
comparisons, which management believes will assist investors in analyzing the financial results for the company and
predicting future performance.
Fiscal Year Ended Fiscal Year Ended
August 31, 2011 August 31, 2010
Net Diluted Net Diluted
Income EPS Income EPS
Reported – GAAP $ 19,225 $ 0.31 $ 21,209 $ 0.34
After-tax net loss from early extinguishment of debt 14,439 0.24 202 –-
Tax benefit from favorable tax settlement (1,073) (0.02) –- –-
Refranchising loss – -- 492 0.01
Impairment provision -- -- 9,776 0.16
Tax benefit of stock option exchange program -- -- (1,751) (0.03)
Adjusted - Non-GAAP $ 32,591 $ 0.53 $ 29,928 $ 0.48
Management's Discussion and Analysis of Financial Condition and Results of Operations
1 7