Snapple 2013 Annual Report Download - page 3
Download and view the complete annual report
Please find page 3 of the 2013 Snapple annual report below. You can navigate through the pages in the report by either clicking on the pages listed below, or by using the keyword search tool below to find specific information within the annual report.-
 1
1 -
 2
2 -
 3
3 -
 4
4 -
 5
5 -
 6
6 -
 7
7 -
 8
8 -
 9
9 -
 10
10 -
 11
11 -
 12
12 -
 13
13 -
 14
14 -
15
-
16
-
17
-
18
-
19
-
20
-
21
-
22
-
23
-
24
-
25
-
26
-
27
-
28
-
29
-
30
-
31
-
32
-
33
-
34
-
35
-
36
-
37
-
38
-
39
-
40
-
41
-
42
-
43
-
44
-
45
-
46
-
47
-
48
-
49
-
50
-
51
-
52
-
53
-
54
-
55
-
56
-
57
-
58
-
59
-
60
-
61
-
62
-
63
-
64
-
65
-
66
-
67
-
68
-
69
-
70
-
71
-
72
-
73
-
74
-
75
-
76
-
77
-
78
-
79
-
80
-
81
-
82
-
83
-
84
-
85
-
86
-
87
-
88
-
89
-
90
-
91
-
92
-
93
-
94
-
95
-
96
-
97
-
98
-
99
-
100
-
101
-
102
-
103
-
104
-
105
-
106
-
107
-
108
-
109
-
110
-
111
-
112
-
113
-
114
-
115
-
116
-
117
-
118
-
119
-
120
-
121
-
122
-
123
-
124
-
125
-
126
-
127
-
128
-
129
-
130
-
131
-
132
-
133
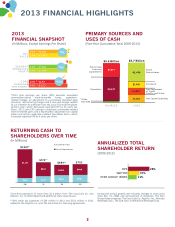
 |
 |

flat
flat
+10%
2012 | $2.92
2013 | $3.20
2012 | $1,364
2013 | $1,364
2012 | $5,995
2013 | $5,997
NET
SALES
SEGMENT
OPERATING
PROFIT
CORE
EARNINGS
PER SHARE*
$702**
‘13
Dividends Paid
Share Repurchases
$1,307*
$773**
$684**
‘10 ‘11 ‘12
$1,113
$194 $251
$522 $400 $400
$302
$284
*2013 core earnings per share (EPS) excludes unrealized
commodity-related mark-to-market losses, separaon-
related charges, an adjustment to a previously disclosed legal
provision, restructuring charges and a non-cash charge related
to our intenon to withdraw from the Local 710 mul-employer
pension plan, which decreased reported EPS by 15 cents per
share. 2012 core EPS excludes unrealized commodity-related
mark-to-market gains and a depreciaon adjustment on capital
leases and certain separaon-related tax-related items, which
increased reported EPS by 4 cents per share.
Compound annual growth rate includes changes in stock price
since Dec. 31, 2008, and reinvestment of dividends. The Peer
Group Index comprises: The Coca-Cola Co., PepsiCo. Inc., Monster
Beverage Corp., The Co Corp. and Naonal Beverage Corp.
*One-me payments of more than $1.6 billion from The Coca-Cola Co. and
PepsiCo. Inc. in 2010 helped fund addional share repurchases.
**DPS made tax payments of $54 million in 2011 and $531 million in 2012
related to the PepsiCo. Inc. and The Coca-Cola Co. licensing agreements.
2013
FINANCIAL SNAPSHOT
(In Millions, Except Earnings Per Share)
PRIMARY SOURCES AND
USES OF CASH
(Five-Year Cumulave Total 2009-2013)
RETURNING CASH TO
SHAREHOLDERS OVER TIME
(In Millions)
ANNUALIZED TOTAL
SHAREHOLDER RETURN
(2009-2013)
.........................................................................................................
2013 FINANCIAL HIGHLIGHTS
3
DPS
S&P 500
PEER GROUP INDEX
28%
15%
11%
SOURCES
Pepsi/Coke
Licensing
Agreements
Operations
Share
Repurchases
Dividends
Net Repayment
of Credit
Facility and Notes
Net Capital Spending
$5.6 Billion $5.7 Billion
USES
$2,435
$1,614
$3,917
*Other,
Net: $95 *
$1,031
$1,163
$1,163
$1,063