Sallie Mae 2008 Annual Report Download - page 93
Download and view the complete annual report
Please find page 93 of the 2008 Sallie Mae annual report below. You can navigate through the pages in the report by either clicking on the pages listed below, or by using the keyword search tool below to find specific information within the annual report.-
 1
1 -
2
-
3
-
4
-
5
-
6
-
7
-
8
-
9
-
10
-
11
-
12
-
13
-
14
-
15
-
16
-
17
-
18
-
19
-
20
-
21
-
22
-
23
-
24
-
25
-
26
-
27
-
28
-
29
-
30
-
31
-
32
-
33
-
34
-
35
-
36
-
37
-
38
-
39
-
40
-
41
-
42
-
43
-
44
-
45
-
46
-
47
-
48
-
49
-
50
-
51
-
52
-
53
-
54
-
55
-
56
-
57
-
58
-
59
-
60
-
61
-
62
-
63
-
64
-
65
-
66
-
67
-
68
-
69
-
70
-
71
-
72
-
73
-
74
-
75
-
76
-
77
-
78
-
79
-
80
-
81
-
82
-
 83
83 -
 84
84 -
 85
85 -
 86
86 -
 87
87 -
 88
88 -
 89
89 -
 90
90 -
 91
91 -
 92
92 -
 93
93 -
 94
94 -
 95
95 -
 96
96 -
 97
97 -
 98
98 -
 99
99 -
 100
100 -
 101
101 -
 102
102 -
 103
103 -
104
-
105
-
106
-
107
-
108
-
109
-
110
-
111
-
112
-
113
-
114
-
115
-
116
-
117
-
118
-
119
-
120
-
121
-
122
-
123
-
124
-
125
-
126
-
127
-
128
-
129
-
130
-
131
-
132
-
133
-
134
-
135
-
136
-
137
-
138
-
139
-
140
-
141
-
142
-
143
-
144
-
145
-
146
-
147
-
148
-
149
-
150
-
151
-
152
-
153
-
154
-
155
-
156
-
157
-
158
-
159
-
160
-
161
-
162
-
163
-
164
-
165
-
166
-
167
-
168
-
169
-
170
-
171
-
172
-
173
-
174
-
175
-
176
-
177
-
178
-
179
-
180
-
181
-
182
-
183
-
184
-
185
-
186
-
187
-
188
-
189
-
190
-
191
-
192
-
193
-
194
-
195
-
196
-
197
-
198
-
199
-
200
-
201
-
202
-
203
-
204
-
205
-
206
-
207
-
208
-
209
-
210
-
211
-
212
-
213
-
214
-
215
-
216
-
217
-
218
-
219
-
220
-
221
-
222
-
223
-
224
-
225
-
226
-
227
-
228
-
229
-
230
-
231
-
232
-
233
-
234
-
235
-
236
-
237
-
238
-
239
-
240
 |
 |

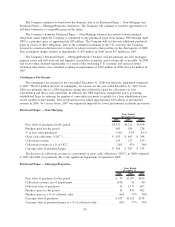
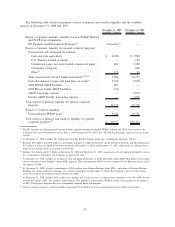
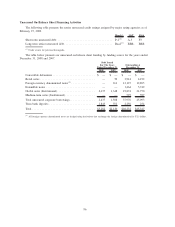
The following table details our primary sources of primary and stand-by liquidity and the available
capacity at December 31, 2008 and 2007.
Available Capacity Available Capacity
December 31, 2008 December 31, 2007
Sources of primary liquidity available for new FFELP Stafford
and PLUS loan originations:
ED Purchase and Participation Programs
(1)
............. Unlimited
(1)
—
Sources of primary liquidity for general corporate purposes:
Unrestricted cash and liquid investments:
Cash and cash equivalents . . ...................... $ 4,070 $ 7,582
U.S. Treasury-backed securities .................... — 643
Commercial paper and asset-backed commercial paper . . . 801 1,349
Certificates of deposit ........................... — 600
Other
(2)
...................................... 133 83
Total unrestricted cash and liquid investments
(3)(4)(5)
...... 5,004 10,257
Unused commercial paper and bank lines of credit
(6)
...... 5,192 6,500
2008 FFELP ABCP Facilities . ...................... 807 —
2008 Private Credit ABCP Facilities .................. 332 —
ABCP borrowing capacity .......................... — 5,933
Interim ABCP Facility borrowing capacity .............. — 4,040
Total sources of primary liquidity for general corporate
purposes ....................................... 11,335 26,730
Sources of stand-by liquidity:
Unencumbered FFELP loans
(7)
........................ 5,222 18,731
Total sources of primary and stand-by liquidity for general
corporate purposes
(8)
.............................. $ 16,557 $45,461
(1)
The ED Purchase and Participation Programs provide unlimited funding for eligible FFELP Stafford and PLUS loans made by the
Company with first disbursements between May 1, 2008 through June 30, 2010. See “ED Funding Programs” discussed earlier in this
section.
(2)
At December 31, 2008, includes $97 million due from The Reserve Primary Fund (see “Counterparty Exposure” below).
(3)
Excludes $26 million and $196 million of investments pledged as collateral related to certain derivative positions and $82 million and
$93 million of other non-liquid investments classified at December 31, 2008 and December 31, 2007, respectively, as cash and invest-
ments on our balance sheet in accordance with GAAP.
(4)
Includes $1.6 billion and $1.3 billion at December 31, 2008 and December 31, 2007, respectively, of cash collateral pledged by deriva-
tive counterparties and held by the Company in unrestricted cash.
(5)
At December 31, 2008, includes $1.1 billion of cash and liquid investments at Sallie Mae Bank, which Sallie Mae Bank was not autho-
rized to dividend to the Company without FDIC approval. This cash primarily will be used to originate Private Education Loans in the
first quarter of 2009.
(6)
At December 31, 2008, excludes commitments of $308 million from Lehman Brothers Bank, FSB, a subsidiary of Lehman Brothers
Holdings, Inc. Lehman Brothers Holdings, Inc. declared bankruptcy on September 15, 2008. The Company’s line of credit commit-
ments decreased by $1.0 billion effective October 23, 2008.
(7)
At December 31, 2008, includes $486 million (face amount and accrued interest) of student loans committed to be sold to ED, but not
settled until January 2009. Also includes approximately $241 million of unencumbered FFELP student loans qualified to be financed
by ED’s Participation Program that were subsequently financed under that program.
(8)
General corporate purposes primarily include originating Private Education Loans and repaying unsecured debt as it matures.
92