Sallie Mae 2008 Annual Report Download - page 26
Download and view the complete annual report
Please find page 26 of the 2008 Sallie Mae annual report below. You can navigate through the pages in the report by either clicking on the pages listed below, or by using the keyword search tool below to find specific information within the annual report.-
 1
1 -
2
-
3
-
4
-
5
-
6
-
7
-
8
-
9
-
10
-
11
-
12
-
13
-
14
-
15
-
 16
16 -
 17
17 -
 18
18 -
 19
19 -
 20
20 -
 21
21 -
 22
22 -
 23
23 -
 24
24 -
 25
25 -
 26
26 -
 27
27 -
 28
28 -
 29
29 -
 30
30 -
 31
31 -
 32
32 -
 33
33 -
 34
34 -
 35
35 -
 36
36 -
37
-
38
-
39
-
40
-
41
-
42
-
43
-
44
-
45
-
46
-
47
-
48
-
49
-
50
-
51
-
52
-
53
-
54
-
55
-
56
-
57
-
58
-
59
-
60
-
61
-
62
-
63
-
64
-
65
-
66
-
67
-
68
-
69
-
70
-
71
-
72
-
73
-
74
-
75
-
76
-
77
-
78
-
79
-
80
-
81
-
82
-
83
-
84
-
85
-
86
-
87
-
88
-
89
-
90
-
91
-
92
-
93
-
94
-
95
-
96
-
97
-
98
-
99
-
100
-
101
-
102
-
103
-
104
-
105
-
106
-
107
-
108
-
109
-
110
-
111
-
112
-
113
-
114
-
115
-
116
-
117
-
118
-
119
-
120
-
121
-
122
-
123
-
124
-
125
-
126
-
127
-
128
-
129
-
130
-
131
-
132
-
133
-
134
-
135
-
136
-
137
-
138
-
139
-
140
-
141
-
142
-
143
-
144
-
145
-
146
-
147
-
148
-
149
-
150
-
151
-
152
-
153
-
154
-
155
-
156
-
157
-
158
-
159
-
160
-
161
-
162
-
163
-
164
-
165
-
166
-
167
-
168
-
169
-
170
-
171
-
172
-
173
-
174
-
175
-
176
-
177
-
178
-
179
-
180
-
181
-
182
-
183
-
184
-
185
-
186
-
187
-
188
-
189
-
190
-
191
-
192
-
193
-
194
-
195
-
196
-
197
-
198
-
199
-
200
-
201
-
202
-
203
-
204
-
205
-
206
-
207
-
208
-
209
-
210
-
211
-
212
-
213
-
214
-
215
-
216
-
217
-
218
-
219
-
220
-
221
-
222
-
223
-
224
-
225
-
226
-
227
-
228
-
229
-
230
-
231
-
232
-
233
-
234
-
235
-
236
-
237
-
238
-
239
-
240
 |
 |
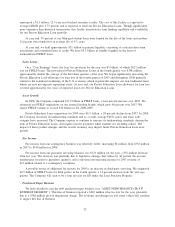
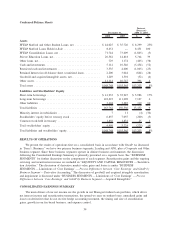
announced a $1.5 billion, 12.5 year asset-backed securities facility. The cost of this facility is expected to
average LIBOR plus 5.75 percent and is expected to fund our Private Education Loans. Though significantly
more expensive than historical transactions, this facility demonstrates term funding capability and availability
for our Private Education Loan portfolio.
At year end, 70 percent of our Managed student loans were funded for the life of the loans and another
12 percent were funded for an average life of 4.3 years.
At year end, we held approximately $11 billion in primary liquidity, consisting of cash and short-term
investments and committed lines of credit. We have $5.2 billion in standby liquidity in the form of
unencumbered FFELP loans.
Loan Losses
On a “Core Earnings” basis, the loan loss provision for the year was $1 billion, of which $127 million
was for FFELP loans. The provision for Private Education Loans in the fourth quarter was $348 million,
approximately double the average of the first three quarters of the year. We began significantly increasing the
Private Education Loan allowance for loan loss in the fourth quarter of 2007 and throughout 2008 primarily
related to the continued weakening of the U.S. economy, which in particular impacts our non-traditional loans
which are now moving into repayment status. At year end, our Private Education Loan allowance for loan loss
covered approximately two years of expected losses for Private Education Loans.
Asset Growth
In 2008, the Company originated $17.9 billion in FFELP loans, a four percent increase over 2007. We
refocused our FFELP originations on our internal lending brands, which grew 48 percent over 2007. We
expect FFELP volume to exceed $20 billion in AY 2008-2009.
Private Education Loan originations for 2008 were $6.3 billion, a 20 percent decline from 2007. In 2008,
the Company increased its underwriting standards and as a result, average FICO scores and loans with
cosigner have increased. The Company expects to continue to increase its underwriting standards, shorten the
term of Private Education Loans, and require interest payments while students are attending school. The
impact of these product changes and the overall economy may impact future Private Education Loan asset
growth.
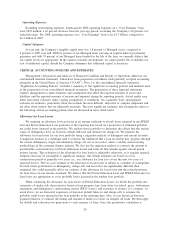
Fee Income
Fee income from our contingency business was relatively stable, increasing $4 million from $336 million
in 2007 to $340 million in 2008.
Fee income from our guarantor servicing business was $121 million for the year, a $35 million decrease
from last year. The decrease was primarily due to legislative changes that reduce by 40 percent the account
maintenance fee paid to guarantee agencies, and a one-time non-recurring increase to 2007 revenue of
$15 million related to a contingency resolution.
A possible source of additional fee income for 2009 is an increase in third-party servicing. We originated
$0.5 billion of FFELP loans for third parties in the fourth quarter, a 14 percent increase from the year-ago
quarter. The Company will seek to be a loan servicer for ED under the Loan Purchase Program.
Purchased Paper Business
We have decided to exit the debt purchased paper business (see “ASSET PERFORMANCE GROUP
BUSINESS SEGMENT”). This line of business reported a $203 million after-tax loss for the year, primarily
due to a $368 million pre-tax impairment charge. The economy and changes in real estate values will continue
to impact this line of business.
25