Ryanair 2011 Annual Report Download - page 11
Download and view the complete annual report
Please find page 11 of the 2011 Ryanair annual report below. You can navigate through the pages in the report by either clicking on the pages listed below, or by using the keyword search tool below to find specific information within the annual report.-
 1
1 -
 2
2 -
 3
3 -
 4
4 -
 5
5 -
 6
6 -
 7
7 -
 8
8 -
 9
9 -
 10
10 -
 11
11 -
 12
12 -
 13
13 -
 14
14 -
 15
15 -
 16
16 -
 17
17 -
 18
18 -
 19
19 -
 20
20 -
 21
21 -
 22
22 -
23
-
24
-
25
-
26
-
27
-
28
-
29
-
30
-
31
-
32
-
33
-
34
-
35
-
36
-
37
-
38
-
39
-
40
-
41
-
42
-
43
-
44
-
45
-
46
-
47
-
48
-
49
-
50
-
51
-
52
-
53
-
54
-
55
-
56
-
57
-
58
-
59
-
60
-
61
-
62
-
63
-
64
-
65
-
66
-
67
-
68
-
69
-
70
-
71
-
72
-
73
-
74
-
75
-
76
-
77
-
78
-
79
-
80
-
81
-
82
-
83
-
84
-
85
-
86
-
87
-
88
-
89
-
90
-
91
-
92
-
93
-
94
-
95
-
96
-
97
-
98
-
99
-
100
-
101
-
102
-
103
-
104
-
105
-
106
-
107
-
108
-
109
-
110
-
111
-
112
-
113
-
114
-
115
-
116
-
117
-
118
-
119
-
120
-
121
-
122
-
123
-
124
-
125
-
126
-
127
-
128
-
129
-
130
-
131
-
132
-
133
-
134
-
135
-
136
-
137
-
138
-
139
-
140
-
141
-
142
-
143
-
144
-
145
-
146
-
147
-
148
-
149
-
150
-
151
-
152
-
153
-
154
-
155
-
156
-
157
-
158
-
159
-
160
-
161
-
162
-
163
-
164
-
165
-
166
-
167
-
168
-
169
-
170
-
171
-
172
-
173
-
174
-
175
-
176
-
177
-
178
-
179
-
180
-
181
-
182
-
183
-
184
-
185
-
186
-
187
-
188
-
189
-
190
-
191
-
192
-
193
-
194
 |
 |

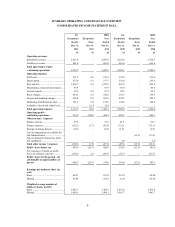
9
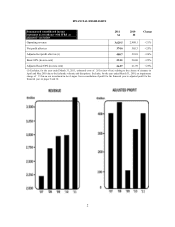
SUMMARY OPERATING AND FINANCIAL OVERVIEW
CONSOLIDATED INCOME STATEMENT DATA
Pre IFRS Pre IFRS
Exceptional Exceptional Year Exceptional Exceptional
Year
Results Items Ended Results Items Ended
Mar 31, Mar 31, Mar 31, Mar 31, Mar 31,
Mar 31,
2011 2011 2011 2010 2010 2010
1M 1M 1M 1M 1M 1M
Operating revenues
Scheduled revenues
................................
2,827.9 - 2,827.9 2,324.5 - 2,324.5
Ancillary revenues
................................
801.6 - 801.6 663.6 - 663.6
Total operating revenues
-continuing operations 3,629.5 - 3,629.5 2,988.1 - 2,988.1
Operating expenses
Staff costs ................................
................................
371.5 4.6 376.1 335.0 - 335.0
Depreciation ................................
................................
273.0 4.7 277.7 235.4 - 235.4
Fuel and oil ................................
................................
1,226.7 0.3 1,227.0 893.9 - 893.9
Maintenance, materials and repairs
................................
93.9 - 93.9 86.0 - 86.0
Aircraft rentals ................................
................................
95.2 2.0 97.2 95.5 - 95.5
Route charges ................................
................................
410.5 0.1 410.6 336.3 - 336.3
Airport and handling charges
................................
490.9 0.9 491.8 459.1 - 459.1
Marketing, distribution & other
................................
151.6 3.0 154.6 144.8 - 144.8
Icelandic volcanic ash related cost
................................
- 12.4 12.4 - - -
Total operating expenses 3,113.3 28.0 3,141.3 2,586.0 - 2,586.0
Operating profit –
continuing operations
516.2
(28.0)
488.2
402.1
-
402.1
Other income / (expense)
Finance income ................................
................................
27.2 - 27.2 23.5 - 23.5
Finance expense ................................
................................
(92.2) (1.7) (93.9) (72.1) - (72.1)
Foreign exchange (losses)
................................
(0.6) - (0.6) (1.0) - (1.0)
Loss on impairment of available for
sale financial asset
................................
-
-
-
-
(13.5)
(13.5)
Gain on disposal of property, plant
and equipment ................................
................................
-
-
-
2.0
-
2.0
Total other income / (expense) (65.6) (1.7) (67.3) (47.6) (13.5) (61.1)
Profit / (loss) before tax 450.6 (29.7) 420.9 354.5 (13.5) 341.0
Tax (expense) / benefit on profit /
(loss) on ordinary activities
................................
(49.9)
3.6
(46.3)
(35.7)
-
(35.7)
Profit / (loss) for the period - all
attributable to equity holders of
parent
400.7
(26.1)
374.6
318.8
(13.5)
305.3
Earnings per ordinary share (in 1
cent)
Basic ................................
................................
26.97 25.21
21.59
20.68
Diluted ................................
................................
26.89
25.14 21.52
20.60
Weighted average number of
ordinary shares (in M’s)
Basic ................................
................................
1,485.7 1,485.7 1,476.4 1,476.4
Diluted ................................
................................
1,490.1 1,490.1 1,481.7 1,481.7