Ricoh 2008 Annual Report Download - page 9
Download and view the complete annual report
Please find page 9 of the 2008 Ricoh annual report below. You can navigate through the pages in the report by either clicking on the pages listed below, or by using the keyword search tool below to find specific information within the annual report.-
 1
1 -
 2
2 -
 3
3 -
 4
4 -
 5
5 -
 6
6 -
 7
7 -
 8
8 -
 9
9 -
 10
10 -
 11
11 -
 12
12 -
 13
13 -
 14
14 -
 15
15 -
 16
16 -
 17
17 -
 18
18 -
 19
19 -
 20
20 -
21
-
22
-
23
-
24
-
25
-
26
-
27
-
28
-
29
-
30
-
31
-
32
-
33
-
34
-
35
-
36
-
37
-
38
-
39
-
40
-
41
-
42
-
43
-
44
-
45
-
46
-
47
-
48
-
49
-
50
-
51
-
52
-
53
-
54
-
55
-
56
-
57
-
58
-
59
-
60
-
61
-
62
-
63
-
64
-
65
-
66
-
67
-
68
-
69
-
70
-
71
-
72
-
73
-
74
 |
 |

ANNUAL REPORT 2008 8
R e v i e w o f O p e r a t i o n s
Fiscal 2008 HighlightsFiscal 2008 Milestones
Sustainable Environmental
Management
Financial Section Corporate Governance /
CSR
To Our Shareholders
and Customers
16th Mid-Term
Management Plan
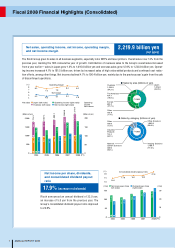
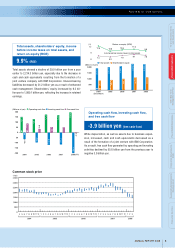
Total assets showed a decline of 29.0 billion yen from a year
earlier to 2,214.3 billion yen, especially due to the decrease in
cash and cash equivalents resulting from the formation of a
joint venture company with IBM Corporation. Interest-bearing
liabilities decreased by 31.2 billion yen as a result of enhanced
cash management. Shareholders’ equity increased by 9.2 bil-
lion yen to 1,080.1 billion yen, refl ecting the increase in retained
earnings.
(%)
(Billions of yen)
Return on equity (ROE)
Income before income taxes on total assets
Total assets Shareholders’ equity
12.6
7.4
10.0
6.9
10.6
7.6
11.0
9.9
8.1 7.8
2,000
1,500
1,000
500
02004
(End of March)
2005 2006 2007
1,852.7
1,953.6
2,041.1
2,243.4
795.1
862.9
960.2
1,070.9
2008
2,214.3
1,080.1
6
9
12
AB
AB
(Billions of yen) Operating cash flow Investing cash flow Free cash flow
200
150
100
50
0
50
-100
-150
-200 2004 (FY)
151.0
87.6
-63.4
2005
129.1
33.0
-96.0
2006
173.4
53.4
-120.0
2007
167.2
51.8
-115.4
2008
194.3
-3.9
-198.3
A
A
B
B
C
C
While depreciation, as well as assets due to business expan-
sion, increased, cash and cash equivalents decreased as a
result of the formation of a joint venture with IBM Corporation.
As a result, free cash fl ow generated by operating and investing
activities declined by 55.8 billion yen from the previous year to
negative 3.9 billion yen.
Common stock price
(Yen)
3,500
3,000
2,500
2,000
1,500
1,000
500
0
2004 2005
4 1 2 3 4 5 6 7 8 95 6 7 8 9
10 11 12 10 11 12
2006
123456789
10 11 12
2007 2008
123 123456789
10 11 12
Total assets, shareholders’ equity, income
before income taxes on total assets, and
return on equity (ROE)
9.9% (ROE)
Operating cash flow, investing cash flow,
and free cash flow
-3.9 billion yen (free cash flow)