Ricoh 2001 Annual Report Download - page 5
Download and view the complete annual report
Please find page 5 of the 2001 Ricoh annual report below. You can navigate through the pages in the report by either clicking on the pages listed below, or by using the keyword search tool below to find specific information within the annual report.-
 1
1 -
 2
2 -
 3
3 -
 4
4 -
 5
5 -
 6
6 -
 7
7 -
 8
8 -
 9
9 -
 10
10 -
 11
11 -
 12
12 -
 13
13 -
 14
14 -
 15
15 -
 16
16 -
17
-
18
-
19
-
20
-
21
-
22
-
23
-
24
-
25
-
26
-
27
-
28
-
29
-
30
-
31
-
32
-
33
-
34
-
35
-
36
-
37
-
38
-
39
-
40
-
41
-
42
-
43
-
44
-
45
-
46
-
47
-
48
-
49
-
50
-
51
-
52
-
53
-
54
-
55
-
56
-
57
-
58
-
59
 |
 |

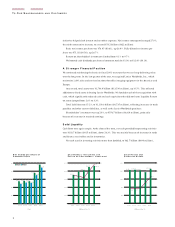
0
400
800
1200
1600
2000
1997
1644.9
1998
1660.5
1999
1628.0
2000
1543.3
2001
1,704.8
0
1
2
3
4
5
1 .8 1 .8 1 .9
2 .6
3 .3
2
initiatives helped slash interest and net other expenses. Net income consequently surged 27.0%,
the ninth consecutive increase, to a record ¥53.2 billion ( $422 m illion) .
Basic net income per share was ¥76.85 ( $0.61) , up 26.8%. Fully diluted net incom e per
share was ¥71.02 ( $0.56) , up 26.7%.
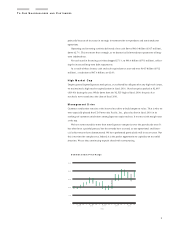
Return on shareholders’ investm ent clim bed from 8.1% to 9.7%.
We boosted cash dividends per share of comm on stock by ¥1.00, to ¥12.00 ( $0.10) .
A S t r o n g e r F in a n c ia l P o s it io n
We continued reinforcing the basics in fiscal 2001 to ensure that we can keep delivering value
over the long term. In the last quarter of the year, we acquired Lanier Worldwide, Inc., which
maintains 1,600 sales and services locations for office im aging equipment in the Americas and
Europe.
At year-end, total assets were ¥1,704.8 billion ( $13,530 million) , up 10.5%. This reflected
additions to fixed assets in buying Lanier Worldwide. We funded m uch of that acquisition with
cash, which significantly reduced cash and cash equivalents but did not harm liquidity. Return
on assets jumped from 2.6% to 3.3%.
Total liabilities rose 15.2%, to ¥1,100.6 billion ( $8,735 million) , reflecting increases in trade
payables and other current liabilities, as well as the Lanier Worldwide purchase.
Shareholders’ investm ent was up 2.8%, to ¥556.7 billion ( $4,418 m illion) , prim arily
because of increases in retained earnings.
S o lid L iq u id it y
Cash flows were again am ple. At the close of the term, net cash provided by operating activities
were ¥102.7 billion ( $815 million) , down 24.3%. This was m ainly because of increases in trade
and finance receivables and in inventories.
Net cash used in investing activities m ore than doubled, to ¥62.7 billion ( $498 million) ,
0
120
240
360
480
600
1997 1998 1999 2000 2001
0
2
4
6
8
1 0
422.9
475.0 487.5
541.5 556.7
7 .0
6 .7 6 .4
8 .1
9 .7
( Billions of Yen, %)
T o t a l A s s e t s a n d
R e t u r n o n A s s e t s
( Billions of Yen, %)
1997
44.16
1998
44.97
1999
44.33
2000 2001
60.61
76.85
0
1 6
3 2
4 8
6 4
8 0
38.95 41.35 40.94
56.06
71.02
N e t In c o m e p e r S h a r e o f
C o m m o n S t o c k
( Yen)
Basic Diluted
S h a r e h o ld e r s ’ In v e s t m en t a n d
R e t u r n o n S h a r e h o ld e r s ’ In v e s t m e n t
TOOU R SH A R E H O L D E R S A N D CU S T O M E R S