Ricoh 2001 Annual Report Download - page 4
Download and view the complete annual report
Please find page 4 of the 2001 Ricoh annual report below. You can navigate through the pages in the report by either clicking on the pages listed below, or by using the keyword search tool below to find specific information within the annual report.-
 1
1 -
 2
2 -
 3
3 -
 4
4 -
 5
5 -
 6
6 -
 7
7 -
 8
8 -
 9
9 -
 10
10 -
 11
11 -
 12
12 -
 13
13 -
 14
14 -
 15
15 -
16
-
17
-
18
-
19
-
20
-
21
-
22
-
23
-
24
-
25
-
26
-
27
-
28
-
29
-
30
-
31
-
32
-
33
-
34
-
35
-
36
-
37
-
38
-
39
-
40
-
41
-
42
-
43
-
44
-
45
-
46
-
47
-
48
-
49
-
50
-
51
-
52
-
53
-
54
-
55
-
56
-
57
-
58
-
59
 |
 |

1
D e liv e r in g V a lu e
Fiscal 2001 was yet another outstanding year, one in which Ricoh continued to deliver value for
its stakeholders. We increased sales and earnings for the seventh and ninth consecutive years,
respectively. We built value by expanding our hardware and solutions lineups. We m aintained
our dom inance of the Japanese copier m arket and leading positions around the world— both in
terms of market share and customer satisfaction. And we acquired new operations to build an
even stronger future internationally.
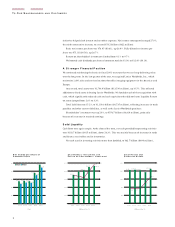
E xc e lle n t S a le s
We boosted net sales 6.3%, to ¥1,538.3 billion ( $12,208 million) , the seventh straight rise.
Based on local currencies, the increase would have been 9.2%. Such growth stemm ed from
surging demand for our printing system s, particularly multifunctional printers ( MFPs) and
high-speed digital plain-paper copies ( PPCs) . Personal com puter, useware, and docum ent solu-
tions operations contributed significantly in line with custom ers’ increasing reliance on networks.
Domestic sales advanced 6.6%, to ¥930.4 billion ( $7,384 m illion) . The prime factors here
were MFPs and other printing solutions, network solutions, optical discs, and semiconductor
operations. Overseas sales were up 5.9%, to ¥607.8 billion ( $4,824 million) . We enj oyed out-
standing growth in the Am ericas and other regions, which com pensated for a decline in Europe
owing to the euro’s average 15% appreciation against the yen during the year. In local currency
terms, our European performance was very solid; without exchange rate changes, overseas
would have risen 13.2%.
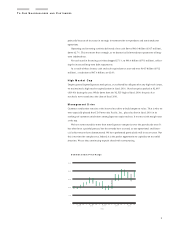
D r a m a t ic E a r n in g s G a in s
Operating income jum ped 18.2%, to ¥105.1 billion ( $834 m illion) . This reflected a significant
increase in unit sales of high-m argin MFPs and generally enhanced profitability in other
operations. Interest and dividend incom e soared. At the sam e tim e, our Group Cash & Cost
TOOU R SH A R E H O L D E R S A N D CU S T O M E R S
0
350
700
1050
1400
1750
1 9 9 7 1 9 9 8
1,316.1
1999
1 ,4 0 3 .3
2000
1,426.0
2001
1,447.2
1,538.3
0
1
2
3
4
5
2 .2 2 .1 2 .1
2 .9
3 .5
N e t S a le s a n d R et u r n o n S a le s
( Billions of Yen, %)
1997
2 8 .9
1998
3 0 .1
1999
3 0 .7
2000
4 1 .9
2001
5 3 .2
0
1 2
2 4
3 6
4 8
6 0
N e t In c o m e
( Billions of Yen)
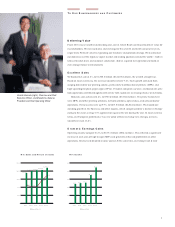
Hiroshi Hamada (right), Chairman and Chief
Executive Officer, and Masamitsu Sakurai,
President and Chief Operating Officer