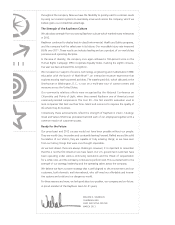
Raytheon 2012 Annual Report Download - page 2
Download and view the complete annual report
Please find page 2 of the 2012 Raytheon annual report below. You can navigate through the pages in the report by either clicking on the pages listed below, or by using the keyword search tool below to find specific information within the annual report.-
 1
1 -
 2
2 -
 3
3 -
 4
4 -
 5
5 -
 6
6 -
 7
7 -
 8
8 -
 9
9 -
 10
10 -
 11
11 -
 12
12 -
 13
13 -
14
-
15
-
16
-
17
-
18
-
19
-
20
-
21
-
22
-
23
-
24
-
25
-
26
-
27
-
28
-
29
-
30
-
31
-
32
-
33
-
34
-
35
-
36
-
37
-
38
-
39
-
40
-
41
-
42
-
43
-
44
-
45
-
46
-
47
-
48
-
49
-
50
-
51
-
52
-
53
-
54
-
55
-
56
-
57
-
58
-
59
-
60
-
61
-
62
-
63
-
64
-
65
-
66
-
67
-
68
-
69
-
70
-
71
-
72
-
73
-
74
-
75
-
76
-
77
-
78
-
79
-
80
-
81
-
82
-
83
-
84
-
85
-
86
-
87
-
88
-
89
-
90
-
91
-
92
-
93
-
94
-
95
-
96
-
97
-
98
-
99
-
100
-
101
-
102
-
103
-
104
-
105
-
106
-
107
-
108
-
109
-
110
-
111
-
112
-
113
-
114
-
115
-
116
-
117
-
118
-
119
-
120
-
121
-
122
-
123
-
124
-
125
-
126
-
127
-
128
-
129
-
130
-
131
-
132
-
133
-
134
-
135
-
136
-
137
-
138
-
139
-
140
-
141
-
142
-
143
-
144
 |
 |

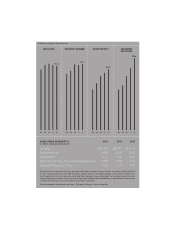
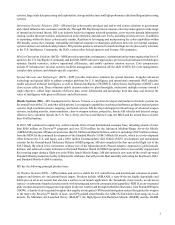
RAYTHEON 2012 FINANCIAL HIGHLIGHTS
YEARS ENDED DECEMBER 31 2010 2011 2012
In millions, except per share amounts
Net Sales $25,150 $24,791 $24,414
Adjusted Income1 2,078 2,067 2,074
Adjusted EPS1 5.51 5.85 6.21
Operating Cash Flow from Continuing Operations 1,892 2,102 1,951
Dividends Declared per Share 1.50 1.72 2.00
In billions, except per share amounts
ADJUSTED EPS1
ADJUSTED INCOME1DIVIDENDS
PER SHARE
NET SALES
1 Adjusted Income is income from continuing operations attributable to Raytheon Company common stockholders and Adjusted EPS is
EPS from continuing operations attributable to Raytheon Company common stockholders excluding, in both cases, the impact of the
FAS/CAS adjustment and, from time to time, certain other items. Adjusted Income and Adjusted EPS are non-GAAP financial measures.
Please see the page that precedes the back cover of this report for information on the excluded items, a reconciliation of these measures
to GAAP and a discussion of why the Company is presenting this information.
Please see the page that precedes the back cover of this report for five year financial information.
$2.00
08 09 10 11 12
$6.21
08 09 10 11 12
$2.1
08 09 10 11 12
$24.4
08 09 10 11 12