Rayovac 2011 Annual Report Download - page 7
Download and view the complete annual report
Please find page 7 of the 2011 Rayovac annual report below. You can navigate through the pages in the report by either clicking on the pages listed below, or by using the keyword search tool below to find specific information within the annual report.-
 1
1 -
 2
2 -
 3
3 -
 4
4 -
 5
5 -
 6
6 -
 7
7 -
 8
8 -
 9
9 -
 10
10 -
 11
11 -
 12
12 -
 13
13 -
 14
14 -
 15
15 -
 16
16 -
 17
17 -
 18
18 -
19
-
20
-
21
-
22
-
23
-
24
-
25
-
26
-
27
-
28
-
29
-
30
-
31
-
32
-
33
-
34
-
35
-
36
-
37
-
38
-
39
-
40
-
41
-
42
-
43
-
44
-
45
-
46
-
47
-
48
-
49
-
50
-
51
-
52
-
53
-
54
-
55
-
56
-
57
-
58
-
59
-
60
-
61
-
62
-
63
-
64
-
65
-
66
-
67
-
68
-
69
-
70
-
71
-
72
-
73
-
74
-
75
-
76
-
77
-
78
-
79
-
80
-
81
-
82
-
83
-
84
-
85
-
86
-
87
-
88
-
89
-
90
-
91
-
92
-
93
-
94
-
95
-
96
-
97
-
98
-
99
-
100
-
101
-
102
-
103
-
104
-
105
-
106
-
107
-
108
-
109
-
110
-
111
-
112
-
113
-
114
-
115
-
116
-
117
-
118
-
119
-
120
-
121
-
122
-
123
-
124
-
125
-
126
-
127
-
128
-
129
-
130
-
131
-
132
-
133
-
134
-
135
-
136
-
137
-
138
-
139
-
140
-
141
-
142
-
143
-
144
-
145
-
146
-
147
-
148
-
149
-
150
-
151
-
152
-
153
-
154
-
155
-
156
-
157
-
158
-
159
-
160
-
161
-
162
-
163
-
164
-
165
-
166
-
167
-
168
-
169
-
170
 |
 |

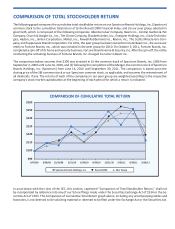
COMPARISON OF TOTAL STOCKHOLDER RETURN
The following graph compares the cumulaƟ ve total stockholder return on our Spectrum Brands Holdings, Inc. (Spectrum)
common stock to the cumulaƟ ve total return of (i) the Russell 2000 Financial Index, and (ii) our peer group selected in
good faith, which is composed of the following companies: Alberto-Culver Company, Beam Inc., Central Garden & Pet
Company, Church & Dwight Co., Inc., The Clorox Company, Elizabeth Arden, Inc., Energizer Holdings, Inc., Exide Technolo-
gies, Hasbro, Inc., Jarden CorporaƟ on, MaƩ el, Inc., Newell Rubbermaid Inc., Revlon, Inc., The ScoƩ s Miracle-Gro Com-
pany, and Tupperware Brands CorporaƟ on. For 2011, the peer group has been revised to include Beam Inc., the successor
enƟ ty to Fortune Brands, Inc., which was included in the peer group for 2010. On October 3, 2011, Fortune Brands, Inc.
completed a spin-oī of its home and security business, Fortune Brands Home & Security, Inc. AŌ er the spin-oī , the enƟ ty
conducƟ ng the remaining business of Fortune Brands, Inc. changed its name to Beam Inc.
The comparison below assumes that $100 was invested in (i) the common stock of Spectrum Brands, Inc. (SBI) from
September 2, 2009 unƟ l June 16, 2010, and (ii) following the compleƟ on of the Merger, the common stock of Spectrum
Brands Holdings, Inc. (Spectrum) from June 16, 2010 unƟ l September 30, 2011. The comparison is based upon the
closing price of the SBI common stock or our Spectrum common stock, as applicable, and assumes the reinvestment of
all dividends, if any. The returns of each of the companies in our peer group are weighted according to the respecƟ ve
company’s stock market capitalizaƟ on at the beginning of each period for which a return is indicated.
Spectrum Brands Holdings, Inc. Russell 2000 Peer Group
COMPARISON OF CUMULATIVE TOTAL RETURN
$160
$150
$140
$130
$120
$110
$100
$90
9/02/09 9/30/09 12/31/09 3/31/10 6/30/10 9/30/10 12/31/10 3/31/11 6/30/11 9/30/11
In accordance with the rules of the SEC, this secƟ on, capƟ oned “Comparison of Total Stockholder Return,” shall not
be incorporated by reference into any of our future fi lings made under the SecuriƟ es Exchange Act of 1934 or the Se-
curiƟ es Act of 1933. The Comparison of CumulaƟ ve Total Return graph above, including any accompanying tables and
footnotes, is not deemed to be soliciƟ ng material or deemed to be fi led under the Exchange Act or the SecuriƟ es Act.