Rayovac 2011 Annual Report Download - page 2
Download and view the complete annual report
Please find page 2 of the 2011 Rayovac annual report below. You can navigate through the pages in the report by either clicking on the pages listed below, or by using the keyword search tool below to find specific information within the annual report.-
 1
1 -
 2
2 -
 3
3 -
 4
4 -
 5
5 -
 6
6 -
 7
7 -
 8
8 -
 9
9 -
 10
10 -
 11
11 -
 12
12 -
 13
13 -
14
-
15
-
16
-
17
-
18
-
19
-
20
-
21
-
22
-
23
-
24
-
25
-
26
-
27
-
28
-
29
-
30
-
31
-
32
-
33
-
34
-
35
-
36
-
37
-
38
-
39
-
40
-
41
-
42
-
43
-
44
-
45
-
46
-
47
-
48
-
49
-
50
-
51
-
52
-
53
-
54
-
55
-
56
-
57
-
58
-
59
-
60
-
61
-
62
-
63
-
64
-
65
-
66
-
67
-
68
-
69
-
70
-
71
-
72
-
73
-
74
-
75
-
76
-
77
-
78
-
79
-
80
-
81
-
82
-
83
-
84
-
85
-
86
-
87
-
88
-
89
-
90
-
91
-
92
-
93
-
94
-
95
-
96
-
97
-
98
-
99
-
100
-
101
-
102
-
103
-
104
-
105
-
106
-
107
-
108
-
109
-
110
-
111
-
112
-
113
-
114
-
115
-
116
-
117
-
118
-
119
-
120
-
121
-
122
-
123
-
124
-
125
-
126
-
127
-
128
-
129
-
130
-
131
-
132
-
133
-
134
-
135
-
136
-
137
-
138
-
139
-
140
-
141
-
142
-
143
-
144
-
145
-
146
-
147
-
148
-
149
-
150
-
151
-
152
-
153
-
154
-
155
-
156
-
157
-
158
-
159
-
160
-
161
-
162
-
163
-
164
-
165
-
166
-
167
-
168
-
169
-
170
 |
 |

GLOBAL BATTERIES
Our baƩ ery products span the globe,
from North America to Europe and
LaƟ n America where we are among
the top one, two or three players
in each region. In Central Europe,
the premium-posiƟ oned VARTA® is
the second largest alkaline baƩ ery
brand. In North America, Rayovac®
is the number-three brand with a
well-defi ned value proposiƟ on, and
in LaƟ n America, the Rayovac® brand
dominates the baƩ ery market. Our
porƞ olio features a wide variety
of consumer baƩ eries including
alkaline, zinc carbon, hearing aid,
rechargeable baƩ eries and chargers.
Rayovac® and VARTA® also market
portable lighƟ ng products.
PERSONAL CARE
Our Remington® brand is a leading
name in electric shaving and grooming
and personal care products including
men’s and women’s shavers, beard and
mustache trimmers, body trimmers,
nose and ear trimmers, hair dryers,
straightening irons, styling irons, and
hairseƩ ers. InnovaƟ ve new products
ensure strong market posiƟ ons. In
North America, Remington® is the
market leader in grooming products
and women’s shavers and holds
the number-two posiƟ on in men’s
shavers. Across Europe, Remington®
is one of the top two hair care brands.
Remington is the leader in hair care
and grooming products in Australia and
New Zealand where it also is number
two in men’s shavers.
GLOBAL PET SUPPLIES
Spectrum’s United Pet Group is the leading
manufacturer of consumer products for the pet supply
markets globally. In the aquaƟ cs category, Tetra® is
the top global premium brand name. Tetra® products
include fi sh food and water treatments, aquariums,
fi lters, heaters, pumps and other aquaƟ c supplies.
Our companion pet products include treats, clean-up
and training aid products, health and grooming aids,
and bedding. These are marketed under brands such
as 8-in-1®, Dingo® and Nature’s Miracle®. United Pet
Group’s well-known products have broad distribuƟ on
throughout North America, Europe and Japan.
HOME & GARDEN
CuƩ er®, Repel®, Hot Shot®, Black Flag® and Spectracide® are
among highly recognized names in our United Industries’ Home
& Garden porƞ olio of branded consumer products. They include
home, lawn and garden insect and weed control products, personal
and area mosquito repellents, and specialty plant care products
which are aƩ racƟ ve markets in North America with high barriers to
entry. Retail distribuƟ on includes home improvement centers, mass
merchandisers, hardware stores, grocery stores and drug chains.
Within these retail locaƟ ons, our products are typically posiƟ oned
as the superior value brand and occupy a strong, number-two
posiƟ on in each category in which they compete.
HOME APPLIANCES
Spectrum’s Russell Hobbs home
appliances business has market-leading
posiƟ ons in six key kitchen appliance
categories, including indoor grills, irons,
toaster ovens, toasters, citrus juicers and
breadmakers. Its well-known and trusted
brands include George Foreman®,
Black & Decker®, Breadman®, Juiceman®,
Farberware® and, in Europe, Russell
Hobbs®. With its strong relaƟ onships
among major retailers worldwide, Russell
Hobbs oī ers a broad and convenient
line of products that appeal to growing
consumer trends for more healthy eaƟ ng
and stay-at-home cooking. Russell Hobbs
products enjoy a leading presence in
North America and Western Europe,
primarily the U.K., with a growing posiƟ on
in Eastern Europe and LaƟ n America.
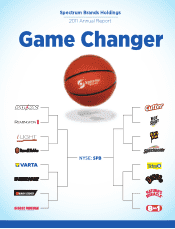
SPECTRUM BRANDS HOLDINGS is a global, diversifi ed and market-driven
consumer products company with fi scal 2011 net sales of $3.2 billion.
Our Company is a leading worldwide supplier of baƩ eries; shaving, grooming and personal care products; small household
appliances; specialty pet supplies; lawn and garden and home pest control products; personal insect repellents; and portable
lighƟ ng. Spectrum Brands’ products are well-known and widely trusted, sold by the world’s top 25 retailers, and available in more
than one million stores in approximately 130 countries around the world. Our reporƟ ng segments include Global BaƩ eries and
Appliances (Personal Care and Home Appliances); Global Pet Supplies; and Home & Garden. Our brands – including Rayovac®,
VARTA®, Remington®, Tetra®, Dingo®, Nature’s Miracle®, George Foreman®, Black & Decker® kitchen appliances, Farberware®,
CuƩ er®, Repel ®, Black Flag® and Spectracide® – are non-discreƟ onary, replacement packaged goods used by consumers on a daily
basis. Headquartered in Madison, Wisconsin, our Company employs some 5,900 people in 43 countries.
Pro Forma Net Sales Adjusted EBITDA
($ in millions) ($ in millions)
(% = margin)
FY2009
$3,006
FY2010
$3,111
FY2011
$3,187
FY2007
$2,333 FY2008
$2,427 FY2007
$272
FY2008
$297
FY2009
$391
FY2010
$432
FY2011
$457
11.7%
12.2%
13.0%
13.9% 14.3%