Rayovac 2011 Annual Report Download - page 4
Download and view the complete annual report
Please find page 4 of the 2011 Rayovac annual report below. You can navigate through the pages in the report by either clicking on the pages listed below, or by using the keyword search tool below to find specific information within the annual report.-
 1
1 -
 2
2 -
 3
3 -
 4
4 -
 5
5 -
 6
6 -
 7
7 -
 8
8 -
 9
9 -
 10
10 -
 11
11 -
 12
12 -
 13
13 -
 14
14 -
 15
15 -
16
-
17
-
18
-
19
-
20
-
21
-
22
-
23
-
24
-
25
-
26
-
27
-
28
-
29
-
30
-
31
-
32
-
33
-
34
-
35
-
36
-
37
-
38
-
39
-
40
-
41
-
42
-
43
-
44
-
45
-
46
-
47
-
48
-
49
-
50
-
51
-
52
-
53
-
54
-
55
-
56
-
57
-
58
-
59
-
60
-
61
-
62
-
63
-
64
-
65
-
66
-
67
-
68
-
69
-
70
-
71
-
72
-
73
-
74
-
75
-
76
-
77
-
78
-
79
-
80
-
81
-
82
-
83
-
84
-
85
-
86
-
87
-
88
-
89
-
90
-
91
-
92
-
93
-
94
-
95
-
96
-
97
-
98
-
99
-
100
-
101
-
102
-
103
-
104
-
105
-
106
-
107
-
108
-
109
-
110
-
111
-
112
-
113
-
114
-
115
-
116
-
117
-
118
-
119
-
120
-
121
-
122
-
123
-
124
-
125
-
126
-
127
-
128
-
129
-
130
-
131
-
132
-
133
-
134
-
135
-
136
-
137
-
138
-
139
-
140
-
141
-
142
-
143
-
144
-
145
-
146
-
147
-
148
-
149
-
150
-
151
-
152
-
153
-
154
-
155
-
156
-
157
-
158
-
159
-
160
-
161
-
162
-
163
-
164
-
165
-
166
-
167
-
168
-
169
-
170
 |
 |

profi tability. The Spectrum Value Model is the heart
of our Company and is redefi ning the value proposi-
Ɵ on for retailers and consumers alike.
Guiding our mulƟ -year strategy for addiƟ o n a l
shareholder value creaƟ on is our clear and straight-
forward vision: To be the leader in retailer metrics with
superior value consumer products for everyday use.
We have the capacity to generate strong and conƟ n-
uous free cash fl ow built upon a diversifi ed revenue
stream, aƩ racƟ ve margins, and the top one, two or
three global market posiƟ on. We have powerful and
enduring brand names in categories with long-term
and steady growth prospects. While the economic
environment worldwide will likely remain challeng-
ing, one of our key strengths is that most Spectrum
Brands products are non-discreƟ onary, replacement
products needed by consumers. Spectrum Brands
also is well-balanced seasonally and geographically
with diverse products and categories.
For fi scal 2012, we expect net sales to increase at
or above the rate of GDP, consistent with what we
have said before about our revenue growth – gener-
ally low-to-mid single digits. We see adjusted EBITDA
increasing at a faster percentage rate, refl ecƟ ng the
leverage typically achieved from higher sales as well
as our conƟ nuing cost reducƟ on, synergies and ex-
pense control iniƟ aƟ ves. Our free cash fl ow target is
approximately $200 million.
Deleveraging and strengthening our balance sheet
remains a top strategic and value creaƟ on priority
for our Company. At the same Ɵ me, another major
priority is pursuing targeted, bolt-on acquisiƟ ons,
primarily in our Global Pet Supplies and Home and
Garden divisions, to drive faster growth and even
higher adjusted EBITDA.
We can think of this as a pendulum swinging, from
Ɵ me to Ɵ me, between deleveraging and debt pay-
down to the other direcƟ on of bolt-on acquisiƟ ons.
AcƟ ve pursuit of these acquisiƟ ons has been in process for
more than a year. When it recently became clear several
of these transacƟ ons, primarily in Global Pet Supplies and
Home and Garden, could happen in the next few months,
we moved quickly to successfully raise $200 million of
opportunisƟ c liquidity to be ready to close these comple-
mentary and synergisƟ c acquisiƟ ons.
These potenƟ al deals, which are excellent strategic fi ts
like our Black Flag/TAT brands acquisiƟ on on November
1 for our Home and Garden division, include FURminator,
the global leader in branded dog/cat grooming products,
for our Global Pet Supplies division. We announced a de-
fi niƟ ve agreement to acquire FURminator on December 6
and expect to close this accreƟ ve transacƟ on by the end
of 2011. These deals will accelerate our EBITDA growth in
fi scal 2012 and on into fi scal 2013 from the synergies and
more organic sales growth they create. With our free cash
fl ow goal of approximately $200 million this year, we plan
to resume signifi cant debt reducƟ on this summer when
our cash levels build on a seasonal basis
and expect to end 2012 at a leverage
raƟ o at or below the 3.4 Ɵ mes
level at year-end 2011.
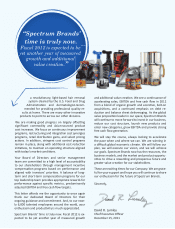
Our business segments have
excelled at introducing
new products and prod-
uct line extensions here
and abroad, and with a
heightened focus on rapidly
expanding the consumables
side of our business. Perhaps
most notably, in our personal
care division, we just entered the
$2 billion U.S. men’s wet shave market with our Remington
King of Shaves Azor® 5 line of 5-blade razors, disposable
cartridges and shaving gels. We also have entered the U.S.
women’s hair care accessories category, nearly a $1 bil-
lion market. And, aŌ er its highly successful introducƟ on in
Europe, we have launched the Remington i-LIGHT™ Pro,
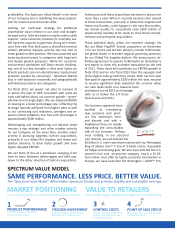
SAME PERFORMANCE. LESS PRICE. BETTER VALUE.
SPECTRUM VALUE MODEL
dŚĞ͞^ƉĞĐƚƌƵŵsĂůƵĞDŽĚĞů͟ĚŝīĞƌĞŶƟĂƚĞƐ^ƉĞĐƚƌƵŵƌĂŶĚƐĂŶĚƉƌŽǀŝĚĞƐƐƚĂďŝůŝƚLJĂŶĚƐƵƐƚĂŝŶĂďůĞĞĂƌŶŝŶŐƐ͘
MARKET POSITIONING
&ŽĐƵƐŽŶηϮďƌĂŶĚƐŝŶŵĂƌŬĞƚƐǁŝƚŚŚŝŐŚďĂƌƌŝĞƌƐƚŽĞŶƚƌLJ
VALUE TO RETAILERS
ĞƐƚƌĞƚĂŝůĞƌŵĂƌŐŝŶ͖ĐĂƚĞŐŽƌLJŵĂŶĂŐĞŵĞŶƚ͖ŵĞƌĐŚĂŶĚŝƐŝŶŐ
1
PRODUCT PERFORMANCE
DĂƚĐŚŽƌĞdžĐĞĞĚĐŽŵƉĞƟƚŽƌ
ƉƌŽĚƵĐƚƉĞƌĨŽƌŵĂŶĐĞ
3
CONTROL COSTS
^ŚĂƌĞĚƐĞƌǀŝĐĞƐ͕ŐůŽďĂůŶĞǁ
ƉƌŽĚƵĐƚĚĞǀĞůŽƉŵĞŶƚĂŶĚ
ĐŽŵŵŽŶƉůĂƞŽƌŵƐ
4
POINT OF SALE FOCUS
tŝŶĂƚƉŽŝŶƚŽĨƐĂůĞ͕ŶŽƚƚŚƌŽƵŐŚ
ďƌĂŶĚĂĚǀĞƌƟƐŝŶŐ
2
FOCUSED INVESTMENT
/ŶǀĞƐƚŝŶƉƌŽĚƵĐƚƉĞƌĨŽƌŵĂŶĐĞ͕
ZΘĂŶĚĐŽƐƚŝŵƉƌŽǀĞŵĞŶƚ