Rayovac 2005 Annual Report Download - page 11
Download and view the complete annual report
Please find page 11 of the 2005 Rayovac annual report below. You can navigate through the pages in the report by either clicking on the pages listed below, or by using the keyword search tool below to find specific information within the annual report.-
 1
1 -
 2
2 -
 3
3 -
 4
4 -
 5
5 -
 6
6 -
 7
7 -
 8
8 -
 9
9 -
 10
10 -
 11
11 -
 12
12 -
 13
13 -
 14
14 -
 15
15 -
 16
16 -
 17
17 -
 18
18 -
 19
19 -
 20
20 -
 21
21 -
 22
22 -
23
-
24
-
25
-
26
-
27
-
28
-
29
-
30
-
31
-
32
-
33
-
34
-
35
-
36
-
37
-
38
-
39
-
40
-
41
-
42
-
43
-
44
-
45
-
46
-
47
-
48
-
49
-
50
-
51
-
52
-
53
-
54
-
55
-
56
-
57
-
58
-
59
-
60
-
61
-
62
-
63
-
64
-
65
-
66
-
67
-
68
-
69
-
70
-
71
-
72
-
73
-
74
-
75
-
76
-
77
-
78
-
79
-
80
-
81
-
82
-
83
-
84
-
85
-
86
-
87
-
88
-
89
-
90
-
91
-
92
-
93
-
94
-
95
-
96
-
97
-
98
-
99
-
100
-
101
-
102
-
103
-
104
-
105
-
106
-
107
-
108
-
109
-
110
-
111
-
112
-
113
-
114
-
115
-
116
-
117
-
118
-
119
-
120
-
121
-
122
-
123
-
124
-
125
-
126
-
127
-
128
-
129
-
130
-
131
-
132
-
133
-
134
 |
 |

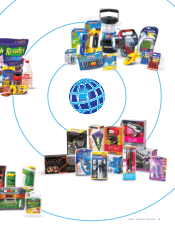
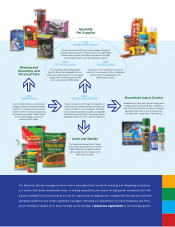
LAWN AND GARDEN
PRODUCTS
A wide variety of lawn and garden care products,
including fertilizers, herbicides, garden and indoor
plant foods, plant care products, potting soils and
other growing media products, and grass seed
GEOGRAPHIC MARKETS
Broad distribution throughout North America
MARKET POSITION*
Strong #2 market share, primarily positioned as
the value alternative
2005 OPERATING HIGHLIGHTS
Nine percent revenue growth in 2005 compared
with stand-alone pre-acquisition results in 2004
COMPETITIVE STRENGTHS
A number of well-recognized brand names;
exclusive house brand supplier relationships
with major home improvement retailers; focused
research and development supporting innova-
tive new product pipeline
INDUSTRY GROWTH TRENDS
Mid-single-digit growth
MAJOR BRANDS
HOUSEHOLD INSECT CONTROL
PRODUCTS
A complete lineup of household insecticides and
insect repellents
GEOGRAPHIC MARKETS
Broad distribution throughout North America
MARKET POSITION*
#2 market share in North America
2005 OPERATING HIGHLIGHTS
Spectrum Brands products performed well in
2005, gaining share through new product intro-
ductions; weather-related weakness in category
caused overall sales to decline 3 percent.
COMPETITIVE STRENGTHS
Premium brand positioning; focused research and
development efforts drive sales through introduc-
tion of competitive new products
INDUSTRY GROWTH TRENDS
Mid-single-digit growth
MAJOR BRANDS
2005 ANNUAL REPORT 9
4-
SPECIALTY PET SUPPLIES
PRODUCTS
A broad line of consumer and commercial aquatics
products, including aquariums, tanks, stands, fi lters,
heaters, pumps, and other aquarium supplies and
accessories; a variety of specialty companion pet
products for dogs, cats, birds and other small
domestic animals, including treats, stain and odor
removal products, health and grooming aids,
and bedding
GEOGRAPHIC MARKETS
Broad distribution throughout North America,
Europe and Japan
MARKET POSITION*
#1 global brand in aquatics; #2 position in
specialty pet supplies in North America
2005 OPERATING HIGHLIGHTS
Global revenue growth of six percent in 2005
compared with stand-alone pre-acquisition
results in 2004.
COMPETITIVE STRENGTHS
Strong premium brand in global aquatics category;
competitive position as world-class supplier to
global retailers in a highly fragmented category
with few competitors of size
INDUSTRY GROWTH TRENDS
Mid-single-digit growth
MAJOR BRANDS