Public Storage 2010 Annual Report Download - page 3
Download and view the complete annual report
Please find page 3 of the 2010 Public Storage annual report below. You can navigate through the pages in the report by either clicking on the pages listed below, or by using the keyword search tool below to find specific information within the annual report.-
 1
1 -
 2
2 -
 3
3 -
 4
4 -
 5
5 -
 6
6 -
 7
7 -
 8
8 -
 9
9 -
 10
10 -
 11
11 -
 12
12 -
 13
13 -
 14
14 -
15
-
16
-
17
-
18
-
19
-
20
-
21
-
22
-
23
-
24
-
25
-
26
-
27
-
28
-
29
-
30
-
31
-
32
-
33
-
34
-
35
-
36
-
37
-
38
-
39
-
40
-
41
-
42
-
43
-
44
-
45
-
46
-
47
-
48
-
49
-
50
-
51
-
52
-
53
-
54
-
55
-
56
-
57
-
58
-
59
-
60
-
61
-
62
-
63
-
64
-
65
-
66
-
67
-
68
-
69
-
70
-
71
-
72
-
73
-
74
-
75
-
76
-
77
-
78
-
79
-
80
-
81
-
82
-
83
-
84
-
85
-
86
-
87
-
88
-
89
-
90
-
91
-
92
-
93
-
94
-
95
-
96
-
97
-
98
-
99
-
100
-
101
-
102
-
103
-
104
-
105
-
106
-
107
-
108
-
109
-
110
-
111
-
112
-
113
-
114
-
115
-
116
-
117
-
118
-
119
-
120
-
121
-
122
-
123
-
124
-
125
-
126
-
127
-
128
 |
 |

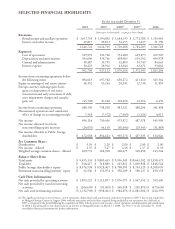
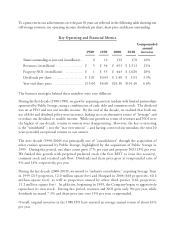
SELECTED FINANCIAL HIGHLIGHTS
Revenues:
Rental income and ancillary operations $ 1,617,705 $ 1,594,892 $ 1,684,333 $ 1,772,788 $ 1,314,969
Interest and other income 29,017 29,813 36,155 11,417 31,799
1,646,722 1,624,705 1,720,488 1,784,205 1,346,768
Expenses:
Cost of operations 529,991 521,706 554,280 629,873 470,503
Depreciation and amortization 354,006 339,766 408,983 619,102 434,978
General and administrative 38,487 35,735 62,809 59,749 84,661
Interest expense 30,225 29,916 43,944 63,671 33,062
952,709 927,123 1,070,016 1,372,395 1,023,204
Income from continuing operations before
the following items 694,013 697,582 650,472 411,810 323,564
Equity in earnings of real estate entities 38,352 53,244 20,391 12,738 11,895
Foreign currency exchange gain (loss),
gains on disposition of real estate
investments and early retirement of debt,
asset impairment charges and casualty
gain, net (43,769) 47,202 310,658 63,656 6,439
Income from continuing operations 688,596 798,028 981,521 488,204 341,898
Discontinued operations and cumulative
effect of change in accounting principle 7,518 (7,572) (7,649) (1,126) 4,011
Net income 696,114 790,456 973,872 487,078 345,909
Net income allocated (to) from
noncontrolling equity interests (24,076) 44,165 (38,696) (29,543) (31,883)
Net income allocable to Public Storage
shareholders $ 672,038 $ 834,621 $ 935,176 $ 457,535 $ 314,026
Per Common Share:
Distributions $ 3.05 $ 2.20 $ 2.80 $ 2.00 $ 2.00
Net income - diluted $ 2.35 $ 3.47 $ 4.18 $ 1.17 $ 0.33
Weighted average common shares - diluted 169,772 168,768 168,675 169,850 143,344
Balance Sheet Data:
Total assets $ 9,495,333 $ 9,805,645 $ 9,936,045 $ 10,643,102 $ 11,198,473
Total debt $ 568,417 $ 518,889 $ 643,811 $ 1,069,928 $ 1,848,542
Public Storage shareholders’ equity $ 8,676,598 $ 8,928,407 $ 8,708,995 $ 8,763,129 $ 8,208,045
Permanent noncontrolling interests’ equity $ 32,336 $ 132,974 $ 358,109 $ 500,127 $ 499,178
Cash Flow Information:
Net cash provided by operating activities $ 1,093,221 $ 1,112,857 $ 1,076,971 $ 1,047,652 $ 769,440
Net cash provided by (used in) investing
activities $ (266,605) $ (91,409) $ 340,018 $ (261,876) $ (473,630)
Net cash used in financing activities $ (1,132,709) $ (938,401) $ (984,076) $ (1,081,504) $ (244,395)
(1) The significant increase in our revenues, cost of operations, depreciation and amortization, and interest expense in 2007 is due to our acquisition
of Shurgard Storage Centers in August 2006, with the operations of the facilities acquired being included in our operations for a full year in
2007 as compared to the period following the acquisition in 2006. The decreases in our revenues, cost of operations, and depreciation and amortization
in 2008 is due primarily to our disposition of an interest in Shurgard Europe on March 31, 2008. See Note 3 to our December 31, 2010
consolidated financial statements for further information.
For the year ended December 31,
2010 2009 2008(1) 2007(1) 2006
(Amounts in thousands, except per share data)