Public Storage 2010 Annual Report Download - page 2
Download and view the complete annual report
Please find page 2 of the 2010 Public Storage annual report below. You can navigate through the pages in the report by either clicking on the pages listed below, or by using the keyword search tool below to find specific information within the annual report.-
 1
1 -
 2
2 -
 3
3 -
 4
4 -
 5
5 -
 6
6 -
 7
7 -
 8
8 -
 9
9 -
 10
10 -
 11
11 -
 12
12 -
 13
13 -
14
-
15
-
16
-
17
-
18
-
19
-
20
-
21
-
22
-
23
-
24
-
25
-
26
-
27
-
28
-
29
-
30
-
31
-
32
-
33
-
34
-
35
-
36
-
37
-
38
-
39
-
40
-
41
-
42
-
43
-
44
-
45
-
46
-
47
-
48
-
49
-
50
-
51
-
52
-
53
-
54
-
55
-
56
-
57
-
58
-
59
-
60
-
61
-
62
-
63
-
64
-
65
-
66
-
67
-
68
-
69
-
70
-
71
-
72
-
73
-
74
-
75
-
76
-
77
-
78
-
79
-
80
-
81
-
82
-
83
-
84
-
85
-
86
-
87
-
88
-
89
-
90
-
91
-
92
-
93
-
94
-
95
-
96
-
97
-
98
-
99
-
100
-
101
-
102
-
103
-
104
-
105
-
106
-
107
-
108
-
109
-
110
-
111
-
112
-
113
-
114
-
115
-
116
-
117
-
118
-
119
-
120
-
121
-
122
-
123
-
124
-
125
-
126
-
127
-
128
 |
 |

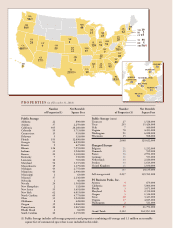
PROPERTIES (as of December 31, 2010)
WA
OR
CA
NV
UT
AZ
HI
CO
NE
KS
OK
TX LA
MO
MN
WI
IL IN OH
MI
KY
TN
AL
MS GA
SC
NC
VA
PA
NY
NH
MA
RI
CT
NJ
DE
MD
FL
91/2
39/3
405/30
24
7
37/4
9
59
1
22
8
235/20 10
37
44
15
126 31 31
43
7
27
221 93
40
69
78/17
28
62
2
2
19
15
5
55
56/6
193/3
UNITED
KINGDOM
FRANCE
GERMANY
NETHERLANDS
BELGIUM
DENMARK
SWEDEN
21
56
11
40
21
10
30
Number Net Rentable
of Properties(1) Square Feet
Public Storage
Arizona 37 2,259,000
California 405 26,160,000
Colorado 59 3,713,000
Florida 193 12,690,000
Illinois 126 7,955,000
Indiana 31 1,926,000
Kansas 22 1,310,000
Louisiana 10 703,000
Minnesota 44 2,990,000
Missouri 37 2,136,000
Nevada 24 1,561,000
Number Net Rentable
of Properties(1) Square Feet
Public Storage
Tennessee 27 1,528,000
Texas 235 15,424,000
onsin 15 968,000
2,048 129,622,000
Shurgard Europe
21 1,252,000
10 559,000
56 2,951,000
11 553,000
40 2,180,000
30 1,614,000
United Kin 21 1,030,000
189 10,139,000
PS Business Parks, Inc.
Arizona 4 679,000
California 30 5,806,000
Florida 3 3,671,000
6 2,352,000
3 1,314,000
Texas 20 3,423,000
17 4,025,000
2 521,000
85 21,791,000
Grand Totals 2,322 161,552 ,000
(1) Public Storage includes self-storage properties and properties combining self-storage and 1.1 million net rentable
square feet of commercial space that is not included in this table.