Public Storage 2010 Annual Report Download - page 14
Download and view the complete annual report
Please find page 14 of the 2010 Public Storage annual report below. You can navigate through the pages in the report by either clicking on the pages listed below, or by using the keyword search tool below to find specific information within the annual report.-
 1
1 -
2
-
3
-
 4
4 -
 5
5 -
 6
6 -
 7
7 -
 8
8 -
 9
9 -
 10
10 -
 11
11 -
 12
12 -
 13
13 -
 14
14 -
 15
15 -
 16
16 -
 17
17 -
 18
18 -
 19
19 -
 20
20 -
 21
21 -
 22
22 -
 23
23 -
 24
24 -
25
-
26
-
27
-
28
-
29
-
30
-
31
-
32
-
33
-
34
-
35
-
36
-
37
-
38
-
39
-
40
-
41
-
42
-
43
-
44
-
45
-
46
-
47
-
48
-
49
-
50
-
51
-
52
-
53
-
54
-
55
-
56
-
57
-
58
-
59
-
60
-
61
-
62
-
63
-
64
-
65
-
66
-
67
-
68
-
69
-
70
-
71
-
72
-
73
-
74
-
75
-
76
-
77
-
78
-
79
-
80
-
81
-
82
-
83
-
84
-
85
-
86
-
87
-
88
-
89
-
90
-
91
-
92
-
93
-
94
-
95
-
96
-
97
-
98
-
99
-
100
-
101
-
102
-
103
-
104
-
105
-
106
-
107
-
108
-
109
-
110
-
111
-
112
-
113
-
114
-
115
-
116
-
117
-
118
-
119
-
120
-
121
-
122
-
123
-
124
-
125
-
126
-
127
-
128
 |
 |

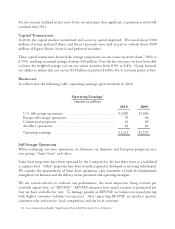
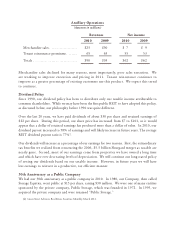
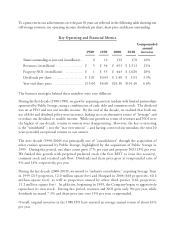
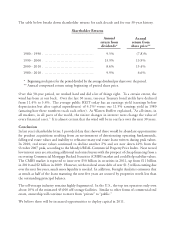
Funds from operations (“FFO”) is a term defined by the National Association of Real Estate Investment Trusts, generally
defined as net income before depreciation expense and gains and losses on sale of real estate. Operating earnings represents
FFO earned at our consolidated real estate locations, combined with FFO before EITF D-42 benefits from our equity
investments (primarily PSB and Shurgard Europe). We believe that FFO is helpful to investors, because net income includes
the impact of depreciation, which assumes that real estate declines in value predictably over time, while we believe that real
performance or our ability to pay dividends.
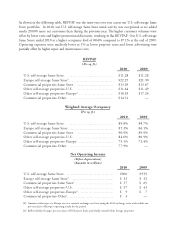
Supplemental Non-GAAP Disclosures (unaudited)
Reconciliation of Net Income to FFO
For the year ended December 31,
(Amounts in thousands, except per share amounts) 2010 2009 2008
Net income: $ 696,114 $ 790,456 $ 973,872
Depreciation and amortization, including equity
earnings, unconsolidated real estate investments and
discontinued operations 415,496 404,438 488,866
Gain on sale, includes our equity share of PSB and
discontinued operations (10,302) (40,119) (336,545)
Net cash provided by operating activities 1,101,308 1,154,775 1,126,193
Preferred unitholders, based upon distributions paid
and redemptions (6,330) 62,545 (21,612)
Other noncontrolling equity interests in subsidiaries (19,585) (20,231) (21,904)
Funds from operations 1,075,393 1,197,089 1,082,677
Less - allocations (to) from:
Preferred shareholders, based upon distributions paid
and redemptions (240,634) (226,213) (205,870)
Restricted share unitholders (2,645) (3,285) (3,263)
Equity Shares, Series A, based upon distributions paid
and redemptions (30,877) (20,524) (21,199)
FFO allocable to our common shareholders $ 801,237 $ 947,067 $ 852,345
Weighted average common shares for purposes of
computing fully-diluted FFO per common share 169,772 168,768 168,675
FFO per common share $ 4.72 $ 5.61 $ 5.05
Reconciliation of Operating Earnings to Net Income
For the year ended December 31,
(Amounts in thousands) 2010 2009
Operating earnings $ 1,213,240 $ 1,196,774
Interest and other income excluding Shurgard Europe 3,896 4,981
Depreciation and amortization / includes equity in earnings (415,116) (402,237)
General and administrative expense (38,487) (35,735)
Interest expense (30,225) (29,916)
Equity share of EITF D-42, acquisition costs and real estate disposition gain for PSB (943) 16,959
Real estate disposition and early debt retirement gain, and asset impairment charges (1,505) 37,540
Foreign currency exchange (loss) gain (42,264) 9,662
Discontinued operations 7,518 (7,572)
Net income $ 696,114 $ 790,456