Public Storage 2008 Annual Report Download - page 5
Download and view the complete annual report
Please find page 5 of the 2008 Public Storage annual report below. You can navigate through the pages in the report by either clicking on the pages listed below, or by using the keyword search tool below to find specific information within the annual report.-
 1
1 -
 2
2 -
 3
3 -
 4
4 -
 5
5 -
 6
6 -
 7
7 -
 8
8 -
 9
9 -
 10
10 -
 11
11 -
 12
12 -
 13
13 -
 14
14 -
 15
15 -
 16
16 -
17
-
18
-
19
-
20
-
21
-
22
-
23
-
24
-
25
-
26
-
27
-
28
-
29
-
30
-
31
-
32
-
33
-
34
-
35
-
36
-
37
-
38
-
39
-
40
-
41
-
42
-
43
-
44
-
45
-
46
-
47
-
48
-
49
-
50
-
51
-
52
-
53
-
54
-
55
-
56
-
57
-
58
-
59
-
60
-
61
-
62
-
63
-
64
-
65
-
66
-
67
-
68
-
69
-
70
-
71
-
72
-
73
-
74
-
75
-
76
-
77
-
78
-
79
-
80
-
81
-
82
-
83
-
84
-
85
-
86
-
87
-
88
-
89
-
90
-
91
-
92
-
93
-
94
-
95
-
96
-
97
-
98
-
99
-
100
-
101
-
102
-
103
-
104
-
105
-
106
-
107
-
108
-
109
-
110
-
111
-
112
-
113
-
114
-
115
-
116
-
117
-
118
-
119
-
120
-
121
-
122
-
123
-
124
-
125
-
126
-
127
-
128
 |
 |

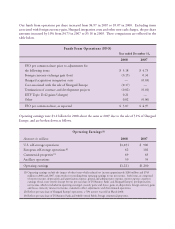
Our funds from operations per share increased from $4.97 in 2007 to $5.07 in 2008. Excluding items
associated with foreign currency gain, Shurgard integration costs and other non-cash charges, the per share
amounts increased by 10% from $4.73 in 2007 to $5.18 in 2008. These comparisons are reflected in the
table below.
Funds From Operations (FFO)
Year ended December 31,
2008 2007
FFO per common share prior to adjustments for
the following items $ 5.18 $ 4.73
Foreign currency exchange gain (loss) (0.15) 0.34
Shurgard acquisition integration costs — (0.03)
Cost associated with the sale of Shurgard Europe (0.17) —
Termination of contract and development projects (0.02) (0.01)
EITF Topic D-42 gains/(charges) 0.21 —
Other 0.02 (0.06)
FFO per common share, as reported $ 5.07 $ 4.97
Operating earnings were $1.2 billion for 2008 about the same as 2007 due to the sale of 51% of Shurgard
Europe, and are broken down as follows.
Operating Earnings(1)
Amounts in millions 2008 2007
U.S. self-storage operations $1,031 $ 980
European self-storage operations (2) 62 102
Commercial properties(3) 69 63
Ancillary operations 59 55
Operating earnings $1,221 $1,200
(1) Operating earnings exclude the impact of other items which reduced net income approximately $286 million and $743
million in 2008 and 2007, respectively, in reconciling from operating earnings to our net income. Such items are comprised
of interest income, depreciation and amortization expense, general and administrative expense, interest expense, equity in
earnings of real estate entities (except for our pro rata share of PS Business Parks’ and Shurgard Europe’s pre-depreciation
net income, which is included in operating earnings), casualty gains and losses, gains on disposition, foreign currency gains
and losses, minority interest in income, cumulative effect adjustments and discontinued operations.
(2) Reflects pro rata share of Shurgard Europe’s operations; a 51% interest was sold in March 2008.
(3) Reflects pro rata share of PS Business Parks and wholly owned Public Storage commercial properties.