Public Storage 2008 Annual Report Download - page 4
Download and view the complete annual report
Please find page 4 of the 2008 Public Storage annual report below. You can navigate through the pages in the report by either clicking on the pages listed below, or by using the keyword search tool below to find specific information within the annual report.-
 1
1 -
 2
2 -
 3
3 -
 4
4 -
 5
5 -
 6
6 -
 7
7 -
 8
8 -
 9
9 -
 10
10 -
 11
11 -
 12
12 -
 13
13 -
 14
14 -
 15
15 -
16
-
17
-
18
-
19
-
20
-
21
-
22
-
23
-
24
-
25
-
26
-
27
-
28
-
29
-
30
-
31
-
32
-
33
-
34
-
35
-
36
-
37
-
38
-
39
-
40
-
41
-
42
-
43
-
44
-
45
-
46
-
47
-
48
-
49
-
50
-
51
-
52
-
53
-
54
-
55
-
56
-
57
-
58
-
59
-
60
-
61
-
62
-
63
-
64
-
65
-
66
-
67
-
68
-
69
-
70
-
71
-
72
-
73
-
74
-
75
-
76
-
77
-
78
-
79
-
80
-
81
-
82
-
83
-
84
-
85
-
86
-
87
-
88
-
89
-
90
-
91
-
92
-
93
-
94
-
95
-
96
-
97
-
98
-
99
-
100
-
101
-
102
-
103
-
104
-
105
-
106
-
107
-
108
-
109
-
110
-
111
-
112
-
113
-
114
-
115
-
116
-
117
-
118
-
119
-
120
-
121
-
122
-
123
-
124
-
125
-
126
-
127
-
128
 |
 |

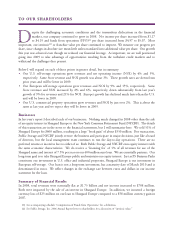
espite the challenging economic conditions and the tremendous dislocations in the financial
markets, our company continued to grow in 2008. Net income per share increased from $1.17
to $4.19 and funds from operations (FFO)(1) per share increased from $4.97 to $5.07. Most
important, our intrinsic(2) or franchise value per share continued to improve. We measure our progress per
share, since changes in absolute size mean little unless translated into additional value per share. Our growth
this year was achieved even though we reduced our financial leverage. As important, we are well positioned
going into 2009 to take advantage of opportunities resulting from the turbulent credit markets and to
withstand the challenges they present.
Below I will expand on each of these points in greater detail, but in summary:
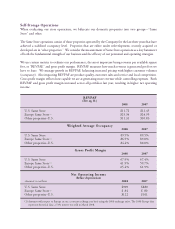
• Our U.S. self-storage operations grew revenues and net operating income (NOI) by 4% and 5%,
respectively. Same Store revenue and NOI growth was about 3%. These growth rates are down from
prior years and will be lower in 2009.
• Our European self-storage operations grew revenues and NOI by 9% and 15%, respectively. Same
Store revenues and NOI increased by 2% and 6%, respectively, down substantially from last year’s
growth of 9% for revenues and 21% for NOI. Europe’s growth has declined much faster than the U.S.
and will be lower in 2009.
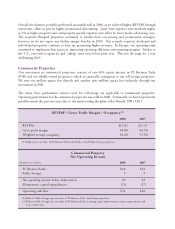
• Our U.S. commercial property operations grew revenues and NOI by just over 2%. This is about the
same as last year and we expect they will be lower in 2009.
Businesses
In last year’s report I described each of our businesses. Nothing much changed in 2008 other than the sale
of an equity interest in Shurgard Europe to the New York Common Retirement Fund (NYCRF). The details
of this transaction are in the notes to the financial statements, but I will summarize here. We sold 51% of
Shurgard Europe for $600 million, resulting in a large “book gain” of about $350 million. Post transaction,
Public Storage and NYCRF jointly oversee the business and participate in major decisions, just like a board
of directors, but the local management team continues to run the day-to-day operations. There are no
preferred returns or incentive fees to either of us. Both Public Storage and NYCRF own equity interests with
the same economic characteristics. We do receive a “licensing fee” of 1% of all revenues for use of the
Shurgard name and interest of 7.5% per year on our 400 million euro loan. We are essentially partners. Our
long-term goal is to take Shurgard Europe public and maintain our equity interest. Just as PS Business Parks
constitutes our investment in U.S. office and industrial properties, Shurgard Europe is our investment in
European self-storage. Our loan is not a long-term investment, has a maturity date of March 2010 and is
denominated in euros. We reflect changes in the exchange rate between euros and dollars in our income
statement for the loan.
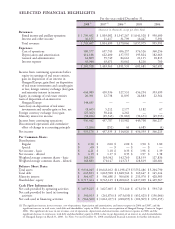
Summary of Financial Results
In 2008, total revenues were essentially flat at $1.75 billion and net income increased to $708 million.
Both were impacted by the sale of an interest in Shurgard Europe. In addition, we incurred a foreign
currency loss of $25 million on our loan to Shurgard Europe compared to a $58 million currency gain in
2007.
TO OUR SHAREHOLDERS
D
(1) See accompanying schedule “Computation of Funds from Operations” for a definition.
(2) See Public Storage, Inc. 2006 Annual Report letter to shareholders for a discussion of “intrinsic value.”