Public Storage 2008 Annual Report Download - page 3
Download and view the complete annual report
Please find page 3 of the 2008 Public Storage annual report below. You can navigate through the pages in the report by either clicking on the pages listed below, or by using the keyword search tool below to find specific information within the annual report.-
 1
1 -
 2
2 -
 3
3 -
 4
4 -
 5
5 -
 6
6 -
 7
7 -
 8
8 -
 9
9 -
 10
10 -
 11
11 -
 12
12 -
 13
13 -
 14
14 -
15
-
16
-
17
-
18
-
19
-
20
-
21
-
22
-
23
-
24
-
25
-
26
-
27
-
28
-
29
-
30
-
31
-
32
-
33
-
34
-
35
-
36
-
37
-
38
-
39
-
40
-
41
-
42
-
43
-
44
-
45
-
46
-
47
-
48
-
49
-
50
-
51
-
52
-
53
-
54
-
55
-
56
-
57
-
58
-
59
-
60
-
61
-
62
-
63
-
64
-
65
-
66
-
67
-
68
-
69
-
70
-
71
-
72
-
73
-
74
-
75
-
76
-
77
-
78
-
79
-
80
-
81
-
82
-
83
-
84
-
85
-
86
-
87
-
88
-
89
-
90
-
91
-
92
-
93
-
94
-
95
-
96
-
97
-
98
-
99
-
100
-
101
-
102
-
103
-
104
-
105
-
106
-
107
-
108
-
109
-
110
-
111
-
112
-
113
-
114
-
115
-
116
-
117
-
118
-
119
-
120
-
121
-
122
-
123
-
124
-
125
-
126
-
127
-
128
 |
 |

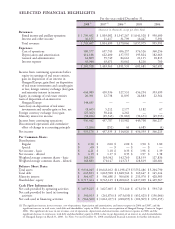
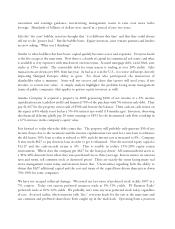
For the year ended December 31,
2008(1) 2007 (1) 2006 (1) 2005 2004
(Amounts in thousands, except per share data)
Revenues:
Rental income and ancillary operations $ 1,709,452 $ 1,803,082 $ 1,347,267 $ 1,041,528 $ 950,600
Interest and other income 36,155 11,417 31,799 16,447 5,391
Total revenues 1,745,607 1,814,499 1,379,066 1,057,975 955,991
Expenses:
Cost of operations 580,577 657,743 496,257 376,526 360,256
Depreciation and amortization 414,188 622,400 437,555 195,824 182,663
General and administrative 62,809 59,749 84,661 21,115 18,813
Interest expense 43,944 63,671 33,062 8,216 760
1,101,518 1,403,563 1,051,535 601,681 562,492
Income from continuing operations before
equity in earnings of real estate entities,
gain on disposition of an interest in
Shurgard Europe, gain (loss) on disposition
of real estate investments and casualty gain
or loss, foreign currency exchange (loss) gain
and minority interest in income 644,089 410,936 327,531 456,294 393,499
Equity in earnings of real estate entities 20,391 12,738 11,895 24,883 22,564
Gain of disposition of an interest in
Shurgard Europe 344,685 — — — —
Gain (loss) on disposition of real estate
investments and casualty gain or loss, net (8,665) 5,212 2,177 1,182 67
Foreign currency exchange (loss) gain (25,362) 58,444 4,262 — —
Minority interest in income (38,696) (29,543) (31,883) (32,651) (49,913)
Income from continuing operations 936,442 457,787 313,982 449,708 366,217
Discontinued operations and cumulative
effect of change in accounting principle (1,266) (252) 44 6,685 (4)
Net income $ 935,176 $ 457,535 $ 314,026 $ 456,393 $ 366,213
Per Common Share:
Distributions:
Regular $ 2.20 $ 2.00 $ 2.00 $ 1.90 $ 1.80
Special $ .60 $ — $ — $ — $ —
Net income - basic $ 4.21 $ 1.18 $ 0.33 $ 1.98 $ 1.39
Net income - diluted $ 4.19 $ 1.17 $ 0.33 $ 1.97 $ 1.38
Weighted average common shares - basic 168,250 169,342 142,760 128,159 127,836
Weighted average common shares - diluted 168,883 170,147 143,715 128,819 128,681
Balance Sheet Data:
Total assets $ 9,936,045 $ 10,643,102 $11,198,473 $ 5,552,486 $ 5,204,790
Total debt $ 643,811 $ 1,069,928 $ 1,848,542 $ 149,647 $ 145,614
Minority interest $ 364,417 $ 506,688 $ 506,030 $ 253,970 $ 428,903
Shareholders’ equity $ 8,715,464 $ 8,763,129 $ 8,208,045 $ 4,817,009 $ 4,429,967
Cash Flow Information:
Net cash provided by operating activities $ 1,059,225 $ 1,027,605 $ 753,140 $ 673,150 $ 593,743
Net cash provided by (used in) investing
activities $ 340,013 $ (261,876) $ (473,630) $ (452,425) $ (156,066)
Net cash used in financing activities $ (966,360) $ (1,061,457) $ (228,095) $ (102,969) $ (276,255)
SELECTED FINANCIAL HIGHLIGHTS
(1) The significant increase in our revenues, cost of operations, depreciation and amortization, and interest expense in 2006 and 2007, and the
significant increase in total assets, total debt and shareholders’ equity in 2006, is due to our acquisition of Shurgard Storage Centers in August
2006. The significant decrease in our revenues, cost of operations, depreciation and amortization, and interest expense in 2008, and the
significant decrease in total assets, total debt and shareholders’ equity in 2008, is due to our disposition of an interest in, and deconsolidation
of, Shurgard Europe on March 31, 2008. See Note 3 to our December 31, 2008 consolidated financial statements for further information.