Public Storage 1996 Annual Report Download - page 3
Download and view the complete annual report
Please find page 3 of the 1996 Public Storage annual report below. You can navigate through the pages in the report by either clicking on the pages listed below, or by using the keyword search tool below to find specific information within the annual report.-
 1
1 -
 2
2 -
 3
3 -
 4
4 -
 5
5 -
 6
6 -
 7
7 -
 8
8 -
 9
9 -
 10
10 -
 11
11 -
 12
12 -
 13
13 -
 14
14 -
15
-
16
-
17
-
18
-
19
-
20
-
21
-
22
-
23
-
24
-
25
-
26
-
27
-
28
-
29
-
30
-
31
-
32
-
33
-
34
-
35
-
36
-
37
-
38
-
39
-
40
-
41
-
42
-
43
-
44
 |
 |

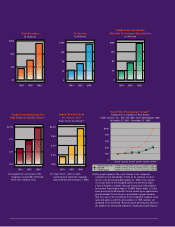
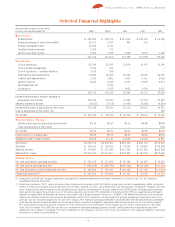
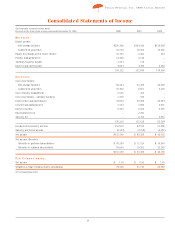
Selected Financial Highlights
P
UBLIC
S
TORAGE
, I
NC
. 1996 A
NNUAL
R
EPORT
1
(In thousands, except per share data)
For the year ended December 31, 1996
(1)
1995
(1)
1994 1993 1992
R
EVENUES
:
Rental income $ 294,005 $ 202,134 $ 141,845 $ 109,203 $ 95,886
Equity in earnings of real estate entities 22,121 3,763 764 563 –
Facility management fees 14,428 2,144 – – –
Ancillary business income 3,504 112 – – –
Interest and other income 7,064 4,497 4,587 4,914 1,562
341,122 212,650 147,196 114,680 97,448
E
XPENSES
:
Cost of operations 93,244 72,247 52,816 42,116 38,348
Cost of facility management 2,575 352 – – –
Cost of operations – ancillary business 3,418 100 – – –
Depreciation and amortization 64,967 40,760 28,274 24,998 22,405
General and administrative 5,524 3,982 2,631 2,541 2,629
Interest expense 8,482 8,508 6,893 6,079 9,834
Environmental cost – 2,741 – – –
Advisory fee – 6,437 4,983 3,619 2,612
178,210 135,127 95,597 79,353 75,828
Income before minority interest and gain on
disposition of real estate 162,912 77,523 51,599 35,327 21,620
Minority interest in income (9,363) (7,137) (9,481) (7,291) (6,895)
Income before gain on disposition of real estate 153,549 70,386 42,118 28,036 14,725
Gain on disposition of real estate, net – – – – 398
Net income $ 153,549 $ 70,386 $ 42,118 $ 28,036 $ 15,123
P
ER
C
OMMON
S
HARE
:
Income before gain on disposition of real estate $1.10 $0.95 $1.05 $0.98 $0.88
Gain on disposition of real estate – – – – 0.02
Net income $1.10 $0.95 $1.05 $0.98 $0.90
Distributions per common share $0.88 $0.88 $0.85 $0.84 $0.84
Weighted average common shares 77,358 41,171 24,077 17,558 15,981
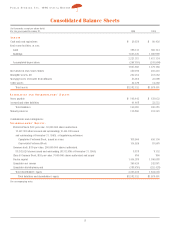
Total assets $2,572,152 $1,937,461 $ 820,309 $ 666,133 $537,724
Total debt $ 108,443 $ 158,052 $ 77,235 $ 84,076 $ 69,478
Minority interest $ 116,805 $ 112,373 $ 141,227 $ 193,712 $202,797
Shareholders’ equity $2,305,437 $1,634,503 $ 587,786 $ 376,066 $253,669
O
THER
D
ATA
:
Net cash provided by operating activities $ 245,237 $ 123,466 $ 79,180 $ 59,477 $ 44,025
Net cash used in investing activities $ (479,626) $ (248,672) $(169,590) $(137,429) $ (21,010)
Net cash provided by (used in) financing activities $ 180,809 $ 185,491 $ 100,029 $ 80,100 $(21,010)
Funds from operations
(2)
$224,384 $ 105,086 $ 56,143 $ 35,830 $ 21,133
(1) During 1996 and 1995 the Company completed several significant business combinations and equity transactions. See Notes 3 and 11 to the Company’s
consolidated financial statements.
(2) Funds from operations (“FFO”), means net income (loss) (computed in accordance with GAAP) before (i) gain (loss) on early extinguishment of debt, (ii) minority
interest in income and (iii) gain (loss) on disposition of real estate, adjusted as follows: (i) plus depreciation and amortization (including the Company’s pro-rata
share of depreciation and amortization of unconsolidated equity interests and amortization of assets acquired in the PSMI Merger, including property manage-
ment agreements and excess purchase cost over net assets acquired), and (ii) less FFO attributable to minority interest. FFO is a supplemental performance
measure for equity REITs as defined by the National Association of Real Estate Investment Trusts, Inc. (“NAREIT”). The NAREIT definition does not specifically
address the treatment of minority interest in the determination of FFO or the treatment of the amortization of property management agreements and excess
purchase cost over net assets acquired. In the case of the Company, FFO represents amounts attributable to its shareholders after deducting amounts attributable
to the minority interests and before deductions for the amortization of property management agreements and excess purchase cost over net assets acquired.
FFO is presented because many analysts consider FFO to be one measure of the performance of the Company and it is used in certain aspects of the terms
of the Class B Common Stock. FFO does not take into consideration scheduled principal payments on debt, capital improvements distributions and other
obligations of the Company. Accordingly, FFO is not a substitute for the Company’s cash flow or net income as a measure of the Company’s liquidity or operating
performance or ability to pay distributions.