Prudential 2005 Annual Report Download - page 9
Download and view the complete annual report
Please find page 9 of the 2005 Prudential annual report below. You can navigate through the pages in the report by either clicking on the pages listed below, or by using the keyword search tool below to find specific information within the annual report.-
 1
1 -
 2
2 -
 3
3 -
 4
4 -
 5
5 -
 6
6 -
 7
7 -
 8
8 -
 9
9 -
 10
10 -
 11
11 -
 12
12 -
 13
13 -
 14
14 -
 15
15 -
 16
16 -
 17
17 -
 18
18 -
 19
19 -
 20
20 -
21
-
22
-
23
-
24
-
25
-
26
-
27
-
28
-
29
-
30
-
31
-
32
-
33
-
34
-
35
-
36
-
37
-
38
-
39
-
40
-
41
-
42
-
43
-
44
-
45
-
46
-
47
-
48
-
49
-
50
-
51
-
52
-
53
-
54
-
55
-
56
-
57
-
58
-
59
-
60
-
61
-
62
-
63
-
64
-
65
-
66
-
67
-
68
-
69
-
70
-
71
-
72
-
73
-
74
-
75
-
76
-
77
-
78
-
79
-
80
-
81
-
82
-
83
-
84
-
85
-
86
-
87
-
88
-
89
-
90
-
91
-
92
-
93
-
94
-
95
-
96
-
97
-
98
-
99
-
100
-
101
-
102
-
103
-
104
-
105
-
106
-
107
-
108
-
109
-
110
-
111
-
112
-
113
-
114
-
115
-
116
-
117
-
118
-
119
-
120
-
121
-
122
-
123
-
124
-
125
-
126
-
127
-
128
-
129
-
130
-
131
-
132
-
133
-
134
-
135
-
136
-
137
-
138
-
139
-
140
-
141
-
142
-
143
-
144
-
145
-
146
-
147
-
148
-
149
-
150
-
151
-
152
-
153
-
154
-
155
-
156
-
157
-
158
-
159
-
160
-
161
-
162
-
163
-
164
-
165
-
166
-
167
-
168
-
169
-
170
-
171
-
172
 |
 |

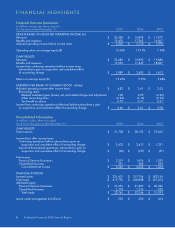
Prudential Financial 2005 Annual Report 7
(A) Adjusted operating income is a
non-GAAP measure that excludes
Realized investment gains (losses),
net (other than those representing
profit or loss of certain of our busi-
nesses which primarily originate
investments for sale or syndication
to unrelated investors, and those
associated with terminating
hedges of foreign currency
earnings and current period yield
adjustments), and related charges
and adjustments; net investment
gains and losses on trading
account assets supporting
insurance liabilities; change in
experience-rated contractholder
liabilities due to asset value
changes; results of divested
businesses and discontinued
operations; cumulative effect of
accounting change; extraordinary
gain on acquisition; and the related
tax effects thereof. Revenues and
benefits and expenses shown as
components of adjusted operating
income, are presented on the same
basis as pre-tax adjusted operating
income and exclude these items
as well.
See Management's Discussion and
Analysis of Financial Condition and
Results of Operations for further
discussion of adjusted operating
results and the Consolidated
Financial Statements for a reconcil-
iation of results based on adjusted
operating income to GAAP results.
(B) Operating return on average
equity is calculated by dividing
adjusted operating income after
income taxes by average attributed
equity for the Financial Services
Businesses excluding unrealized
gains and losses on investments.
An alternative measure to oper-
ating return on average equity is
return on average equity. Return on
average equity is calculated by
dividing income from continuing
operations after income taxes by
average total attributed equity for
the Financial Services Businesses.
Both income amounts above give
effect to the direct equity adjustment
for earnings per share calculation.
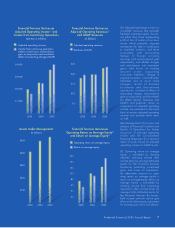
Financial Services Businesses
Adjusted Operating Income(A) and
Income from Continuing Operations
(pre-tax, in millions)
Financial Services Businesses
Adjusted Operating Revenues(A)
and GAAP Revenues
(in billions)
Assets Under Management
(in billions)
$4,000-
$3,000-
$2,000-
$1,000-
-
2003 2004 2005 2003 2004 2005
2003 2004 2005 2003 2004 2005
$500-
$400-
$300-
$200-
$100-
-
16%-
14%-
12%-
10%-
8%-
6%-
4%-
2%-
-
$25-
$20-
$15-
$10-
$5-
-
Financial Services Businesses
Operating Return on Average Equity(B)
and Return on Average Equity(B)
Adjusted operating income
Income from continuing operations
before income taxes, extraordinary
gain on acquisition and cumulative
effect of accounting change (GAAP)
Adjusted operating revenues
Revenues (GAAP)
Operating return on average equity
Return on average equity