Prudential 2005 Annual Report Download - page 17
Download and view the complete annual report
Please find page 17 of the 2005 Prudential annual report below. You can navigate through the pages in the report by either clicking on the pages listed below, or by using the keyword search tool below to find specific information within the annual report.-
 1
1 -
2
-
3
-
4
-
5
-
6
-
 7
7 -
 8
8 -
 9
9 -
 10
10 -
 11
11 -
 12
12 -
 13
13 -
 14
14 -
 15
15 -
 16
16 -
 17
17 -
 18
18 -
 19
19 -
 20
20 -
 21
21 -
 22
22 -
 23
23 -
 24
24 -
 25
25 -
 26
26 -
 27
27 -
28
-
29
-
30
-
31
-
32
-
33
-
34
-
35
-
36
-
37
-
38
-
39
-
40
-
41
-
42
-
43
-
44
-
45
-
46
-
47
-
48
-
49
-
50
-
51
-
52
-
53
-
54
-
55
-
56
-
57
-
58
-
59
-
60
-
61
-
62
-
63
-
64
-
65
-
66
-
67
-
68
-
69
-
70
-
71
-
72
-
73
-
74
-
75
-
76
-
77
-
78
-
79
-
80
-
81
-
82
-
83
-
84
-
85
-
86
-
87
-
88
-
89
-
90
-
91
-
92
-
93
-
94
-
95
-
96
-
97
-
98
-
99
-
100
-
101
-
102
-
103
-
104
-
105
-
106
-
107
-
108
-
109
-
110
-
111
-
112
-
113
-
114
-
115
-
116
-
117
-
118
-
119
-
120
-
121
-
122
-
123
-
124
-
125
-
126
-
127
-
128
-
129
-
130
-
131
-
132
-
133
-
134
-
135
-
136
-
137
-
138
-
139
-
140
-
141
-
142
-
143
-
144
-
145
-
146
-
147
-
148
-
149
-
150
-
151
-
152
-
153
-
154
-
155
-
156
-
157
-
158
-
159
-
160
-
161
-
162
-
163
-
164
-
165
-
166
-
167
-
168
-
169
-
170
-
171
-
172
 |
 |

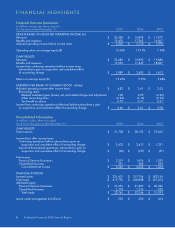
We analyze performance of the segments and Corporate and Other operations of the Financial Services Businesses using a measure
called adjusted operating income. See “—Consolidated Results of Operations” for a definition of adjusted operating income and a
discussion of its use as a measure of segment operating performance.
Shown below are the contributions of each segment and Corporate and Other operations to our adjusted operating income for the years
ended December 31, 2005, 2004 and 2003 and a reconciliation of adjusted operating income of our segments and Corporate and Other
operations to income from continuing operations before income taxes, extraordinary gain on acquisition and cumulative effect of
accounting change.
Year ended
December 31,
2005 2004 2003
(in millions)
Adjusted operating income before income taxes for segments of the Financial Services Businesses:
Individual Life and Annuities .......................................................................... $1,003 $ 817 $ 619
Group Insurance .................................................................................... 224 174 169
Asset Management .................................................................................. 464 266 208
Financial Advisory .................................................................................. (255) (245) (111)
Retirement ......................................................................................... 498 334 192
International Insurance ............................................................................... 1,310 917 819
International Investments ............................................................................. 110 86 (10)
Corporate and Other ................................................................................. 198 167 84
Items excluded from adjusted operating income:
Realized investment gains (losses), net, and related adjustments ............................................... 672 82 (156)
Charges related to realized investment gains (losses), net .................................................... (108) (58) (43)
Investment gains (losses) on trading account assets supporting insurance liabilities, net ............................ (33) (55) —
Change in experience-rated contractholder liabilities due to asset value changes .................................. (44) 1 —
Divested businesses ................................................................................. (50) (33) (158)
Income from continuing operations before income taxes, extraordinary gain on acquisition and cumulative effect of accounting
change for Financial Services Businesses ................................................................... 3,989 2,453 1,613
Income from continuing operations before income taxes for Closed Block Business ................................... 482 915 370
Consolidated income from continuing operations before income taxes, extraordinary gain on acquisition and cumulative effect
of accounting change .................................................................................. $4,471 $3,368 $1,983
Results for 2005 presented above reflect the following:
• Improved results from our International Insurance segment, including pre-tax adjusted operating income of $502 million from our
Gibraltar Life operations and pre-tax adjusted operating income of $808 million from our international insurance operations other
than Gibraltar Life.
• Improved results from our Individual Life and Annuities segment. Individual life results benefited primarily from lower expenses
and increased investment income, net of interest credited to policyholders’ account balances and interest expense. Individual
annuity 2005 results benefited from a net $87 million reduction in benefits and expenses from changes in estimated total gross
profits used as a basis for amortizing deferred policy acquisition costs, decreased cost of actual and expected death claims and
modeling refinements implemented, as well as increased fee income.
• Improved results from our Retirement segment, for which results include the contribution of the business we acquired from CIGNA
commencing at the date of acquisition, April 1, 2004. Results of the segment’s original retirement business benefited from mortgage
prepayment income and reserve releases from refinements and updates of client census data totaling $76 million in 2005.
• Improved results in our Asset Management segment, reflecting higher asset based fees as a result of increased asset values and
higher performance based incentive and transaction fees. Results for 2005 benefited from income of $58 million during the first half
of the year from two sale transactions in the segment’s proprietary investing business.
• Improved results from our Group Insurance segment, reflecting an increase in net investment income and growth in the group life
insurance business, as well a lower costs related to legal and regulatory matters.
• International Investments segment pre-tax adjusted operating income of $110 million in 2005, reflecting improved results of
Prudential Investment & Securities Co., Ltd., which we acquired in the first quarter of 2004.
• Financial Advisory segment loss, on a pre-tax adjusted operating income basis, of $255 million in 2005 in comparison to a loss of
$245 million in 2004. Results in 2005 include expenses of $452 million related to obligations and costs we retained in connection
with the businesses contributed to the retail brokerage joint venture with Wachovia, primarily for litigation and regulatory matters,
compared to $227 million in 2004. The segment’s results for 2005 also include $20 million of costs associated with the business
transition, which was completed in the second quarter of 2005, while 2004 results included $194 million of these costs.
• Realized investment gains (losses), net, and related adjustments for the Financial Services Businesses of $672 million in 2005,
primarily reflecting fluctuations in value of hedging instruments covering our foreign currency risk and investments, as well as
realized investment gains from the sale of equity securities.
• Income from continuing operations before income taxes of the Closed Block Business of $482 million in 2005, including realized
investment gains of $636 million.
Prudential Financial 2005 Annual Report 15