Progressive 2003 Annual Report Download - page 20
Download and view the complete annual report
Please find page 20 of the 2003 Progressive annual report below. You can navigate through the pages in the report by either clicking on the pages listed below, or by using the keyword search tool below to find specific information within the annual report.-
 1
1 -
2
-
3
-
4
-
5
-
6
-
7
-
8
-
9
-
 10
10 -
 11
11 -
 12
12 -
 13
13 -
 14
14 -
 15
15 -
 16
16 -
 17
17 -
 18
18 -
 19
19 -
 20
20 -
 21
21 -
 22
22 -
 23
23 -
 24
24 -
 25
25 -
 26
26 -
 27
27 -
 28
28 -
 29
29 -
 30
30 -
31
-
32
-
33
-
34
-
35
-
36
-
37
-
38
-
39
-
40
-
41
-
42
-
43
-
44
-
45
-
46
-
47
-
48
-
49
-
50
-
51
-
52
-
53
 |
 |

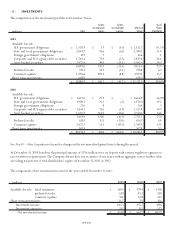
The components of other comprehensive income for the years ended December 31were as follows:
2003 2002 2001
Tax Tax Tax
(Provision) After (Provision) After (Provision) After
(millions) Pretax Benefit Tax Pretax Benefit Tax Pretax Benefit Tax
Unrealized gains (losses)
arising during period:
Available-for-sale:
fixed maturities $ 2.8 $ (.9) $ 1.9 $ 240.9 $ (84.3) $ 156.6 $ 17.0 $ (5.9) $ 11.1
equity securities 431.6 (151.1) 280.5 (137.8) 48.2 (89.6) 40.9 (14.3) 26.6
Reclassification adjustment:1
Available-for-sale:
fixed maturities (71.5) 25.0 (46.5) (13.8) 4.7 (9.1) 16.7 (5.8) 10.9
equity securities 30.6 (10.7) 19.9 (26.2) 9.2 (17.0) 5.2 (1.8) 3.4
Net unrealized gains (losses) 393.5 (137.7) 255.8 63.1 (22.2) 40.9 79.8 (27.8) 52.0
Net unrealized gains
on forecasted transactions2(1.5) .5 (1.0) 3.8 (1.3) 2.5 14.2 (5.0) 9.2
Foreign currency
translation adjustment3.9 — .9 ——— ———
Other comprehensive
income $ 392.9 $ (137.2) $ 255.7 $ 66.9 $ (23.5) $ 43.4 $ 94.0 $ (32.8) $ 61.2
1Represents adjustments for gains (losses) realized in net income for securities held in the portfolio at December 31of the preceding year.
2Entered into for the purpose of managing interest rate risk associated with debt issuances. See Note 4 – Debt.The Company expects to reclassify $1.6 million into income
within the next 12 months.
3Foreign currency translation adjustments have no tax effect.
- 10 - OTHER COMPREHENSIVE INCOME
- APP.-B-20 -
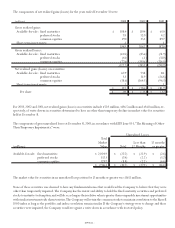
Following are the operating results for the years ended December 31:
2003 2002 2001
Pretax Pretax Pretax
(millions) Revenues Profit (Loss) Revenues Profit (Loss) Revenues Profit (Loss)
Personal Lines – Agency $6,948.0 $ 836.0 $5,542.7 $ 388.0 $4,706.8 $ 251.2
Personal Lines – Direct 3,103.0 383.0 2,365.1 203.8 1,787.0 40.9
To t a l Pe r s o n al Lines110,051.0 1,219.0 7,907.8 591.8 6,493.8 292.1
Commercial Auto Business 1,226.7 214.2 880.0 80.0 552.3 45.7
Other businesses213 6.3 55.5 13 0.0 19.1 14 0.4 13.0
Investments3478.0 466.5 376.6 365.1 301.7 289.0
Interest expense — (95.5 ) — ( 74.6 )—(52.2)
$11,892.0 $ 1,859.7 $ 9,294.4 $ 981.4 $7,488.2 $ 587.6
1Personal automobile insurance accounted for 93% of the total Personal Lines segment net premiums written in 2003,2002 and 2001.
2For 2003, both revenues and pretax profit include $31.2 million of estimated interest income related to an income tax refund the Company will receive. See Note 3 –
Income Taxes for further discussion.
3Revenues represent recurring investment income and net realized gains (losses) on securities; pretax profit is net of investment expenses.