Principal Financial Group 2012 Annual Report Download - page 7
Download and view the complete annual report
Please find page 7 of the 2012 Principal Financial Group annual report below. You can navigate through the pages in the report by either clicking on the pages listed below, or by using the keyword search tool below to find specific information within the annual report.-
 1
1 -
 2
2 -
 3
3 -
 4
4 -
 5
5 -
 6
6 -
 7
7 -
 8
8 -
 9
9 -
 10
10 -
 11
11 -
 12
12 -
 13
13 -
 14
14 -
 15
15 -
 16
16 -
 17
17 -
 18
18 -
19
-
20
 |
 |

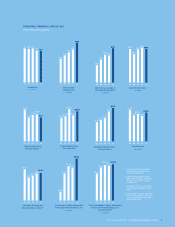
Assets Under
Management
(in billions)
$319
$403
$247
$285
$335
08 09 10 11 12
Common Share Price
As of Year End
$22.57
$24.60
$24.04
$32.56
$28.52
08 09 10 11 12
Total Revenue2
(in millions)
$9,215
$9,935
$8,856
$9,198
$8,671
08 09 10 11 12
Net Income Available to
Common Stockholders2
(in millions)
$396
$524
$630 $620
$773
08 09 10 11 12 08 09 10 11 12
Operating Earnings2, 3
(in millions)
$803
$682
$807 $808
$844
08 09 10 11 12
Operating Return on
Average Equity2, 3, 4
9.6%
13.1%
9.6%
10.0%
10.2%
Operating Earnings per
Diluted Common Share2, 3
$2.69
$3.09
$2.28
$2.49$2.66
08 09 10 11 12
Stockholders’ Equity Attributable
to Principal Financial Group, Inc.2
(in millions)
$9,149
$7,297
$1,866
$9,018
$9,753
08 09 10 11 12
Total Stockholders’ Equity Attributable
to Principal Financial Group, Inc.
excluding AOCI2
(in millions)
$8,301
$8,218
$8,579
$7,817
$6,332
Customers1
(in millions)
08 09 10 11 12 08 09 10 11 12
Annual Dividends Paid on
Common Stock
$0.78
$0.45
$0.50
$0.55
$0.70
08 09 10 11 12
18.3
19.7 19.5 19.6
18.5
PRINCIPAL FINANCIAL GROUP, INC.
2012 Financial Highlights
1. Includes employees and their
dependents under employee
bene t arrangements.
2. Certain reclassi cations have
been made to 2008, 2009, 2010
and 2011 to conform to 2012
presentation.
3. See page 16 for a reconciliation
of non-GAAP measures to U.S.
GAAP.
4. Stockholders’ equity available to
common stockholders excluding
accumulated other comprehen-
sive income (loss).
2012 YEAR IN REVIEW | THE PRINCIPAL FINANCIAL GROUP 5