Popeye's 2015 Annual Report Download - page 4
Download and view the complete annual report
Please find page 4 of the 2015 Popeye's annual report below. You can navigate through the pages in the report by either clicking on the pages listed below, or by using the keyword search tool below to find specific information within the annual report.-
 1
1 -
 2
2 -
 3
3 -
 4
4 -
 5
5 -
 6
6 -
 7
7 -
 8
8 -
 9
9 -
 10
10 -
 11
11 -
 12
12 -
 13
13 -
 14
14 -
 15
15 -
16
-
17
-
18
-
19
-
20
-
21
-
22
-
23
-
24
-
25
-
26
-
27
-
28
-
29
-
30
-
31
-
32
-
33
-
34
-
35
-
36
-
37
-
38
-
39
-
40
-
41
-
42
-
43
-
44
-
45
-
46
-
47
-
48
-
49
-
50
-
51
-
52
-
53
-
54
-
55
-
56
-
57
-
58
-
59
-
60
-
61
-
62
-
63
-
64
-
65
-
66
-
67
-
68
-
69
-
70
-
71
-
72
-
73
-
74
-
75
-
76
-
77
-
78
-
79
-
80
-
81
-
82
-
83
-
84
-
85
-
86
-
87
-
88
 |
 |

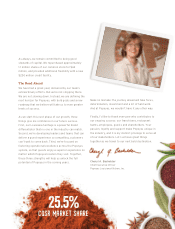
Adjusted earnings per diluted share
2011 2012 2013 2014 2015
$0.99
$1.43
$1.65
$1.91
$1.24
To Our Stakeholders,
If there is one thing that sets Popeyes® apart, it’s our drive to deliver exceptional results. In fact,
we’re just as passionate about our financial and operational performance as we are about our
flavorful food and distinctive Louisiana brand. That is why we’ve spent the past seven years
finding new ways to make Popeyes even better.
Our journey started with the simple, yet powerful,
decision to make franchise owners our top priority.
With their long-term success as our north star, we
crafted a roadmap with new guiding principles, new
goals and new growth strategies. Then came the hard
part — executing the roadmap with consistency,
discipline and focus.
I am pleased to say that our commitment to
excellence has paid off. Since 2008, we have built
1,236 new restaurants globally, including 552
internationally. We have posted seven consecutive
years of global same-store sales increases. Average
domestic unit volumes have grown from just under
$1 million to nearly $1.4 million. We have nearly
doubled domestic franchise Restaurant Operating
Profits (ROP) from $177,000 in 2008 to $340,000 in
2015. Perhaps most importantly, we have grown our
share of the Chicken Quick Service Restaurant (CQSR)
market from just 14.8 percent in 2008 to 25.5 percent
in 2015.
Fueled by our passion for performance, these
remarkable long-term results are a testament to the
power of our franchisee relationships, flavorful food
and compelling brand.
2015 Results
With seven years of momentum to build on, we once
again served up exceptional results in 2015. We
opened 219 new restaurants, reaching a total of 2,539
by year-end. In the process, we grew global system-
wide sales by 5.9 percent, reaching a two-year
compound growth rate of 12.5 percent. We also posted
our seventh consecutive year of domestic same-store
sales growth, and our ninth consecutive year of
international same-store sales growth.
Even as we grew at a record pace, our focus on
working with franchisees to increase efficiencies and
manage costs drove domestic restaurant operating
profit margins up to 23 percent, which translates to
average profits of $340,000 per location. There’s
simply never been a better time to own a Popeyes
restaurant — and our franchisees couldn’t agree more.
In a recent survey, nearly 95 percent of our franchise
owners said they would invest in Popeyes again.
With our strong sales and unit growth, we generated
free cash flow of $58.6 million, a 22 percent increase
over 2014. We reported adjusted earning per diluted
share of $1.91, as compared to $1.65 in 2014, a 15.8
percent increase.
2POPEYES LOUISIANA KITCHEN, INC. 2015 ANNUAL REPORT