Polaris 2008 Annual Report Download - page 2
Download and view the complete annual report
Please find page 2 of the 2008 Polaris annual report below. You can navigate through the pages in the report by either clicking on the pages listed below, or by using the keyword search tool below to find specific information within the annual report.-
 1
1 -
 2
2 -
 3
3 -
 4
4 -
 5
5 -
 6
6 -
 7
7 -
 8
8 -
 9
9 -
 10
10 -
 11
11 -
 12
12 -
 13
13 -
14
-
15
-
16
-
17
-
18
-
19
-
20
-
21
-
22
-
23
-
24
-
25
-
26
-
27
-
28
-
29
-
30
-
31
-
32
-
33
-
34
-
35
-
36
-
37
-
38
-
39
-
40
-
41
-
42
-
43
-
44
-
45
-
46
-
47
-
48
-
49
-
50
-
51
-
52
-
53
-
54
-
55
-
56
-
57
-
58
-
59
-
60
-
61
-
62
-
63
-
64
-
65
-
66
-
67
-
68
-
69
-
70
-
71
-
72
-
73
-
74
-
75
-
76
-
77
-
78
-
79
-
80
-
81
-
82
-
83
-
84
-
85
-
86
-
87
-
88
-
89
-
90
 |
 |

Table of Contents IFC Polaris at a Glance
1 Letter from the CEO
and COO
10 11-Year Selected
Financial Data
12 Board of Directors and
Corporate Officers
13 Form 10-K
IBC Other Investor Information
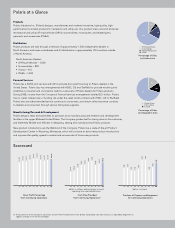
Sales
(dollars in millions)
$1,657
$1,780
$1,948
06
$1,870
05
$1,773
04
$1,552
03
$1,468
02
$1,427
01
$1,327
00
$1,225
99 07 08
Net Income from Continuing
Operations Per Share
(dollars)
$2.72
$3.10
$3.50
06
$3.15
05
$2.97
04
$2.58
03
$ 2.28
02
$1.99
01
$1.81
00
$1.64
99 07 08
NOTE: All periods presented reflect the classification of the marine products division’s financial results as discontinued operations.
Financial Highlights
(dollars and shares in thousands, except per-share data) 2008 2007 % Change
For the Year
Sales $ 1,948,254 $ 1,780,009 9%
Operating income 182,799 176,036 4%
Net income from continuing operations 117,395 112,598 4%
Percent of sales 6.0% 6.3%
Per Share
Net income from continuing operations (diluted) $ 3.50 $ 3.10 13%
Dividends paid 1.52 1.36 12%
Average shares outstanding (diluted) 33,564 36,324 – 8%
Financial Position
Total assets $ 751,148 $ 769,881 – 2%
Stockholders’ equity 137,027 172,982 – 21%
Other Information
Property and equipment (net) $ 215,637 $ 204,351 6%
Capital expenditures 76,575 63,747 20%
Depreciation and amortization 66,112 62,093 6%
Borrowings under credit agreement 200,000 200,000 0%
Total credit facility 450,000 450,000 0%
Return on average shareholder equity 76% 66%
Average dividend yield 4.0% 2.9%
Number of employees – average 3,300 3,200 3%
Stock price at year end 28.65 47.77 – 40%