Polaris 2005 Annual Report Download - page 3
Download and view the complete annual report
Please find page 3 of the 2005 Polaris annual report below. You can navigate through the pages in the report by either clicking on the pages listed below, or by using the keyword search tool below to find specific information within the annual report.-
 1
1 -
 2
2 -
 3
3 -
 4
4 -
 5
5 -
 6
6 -
 7
7 -
 8
8 -
 9
9 -
 10
10 -
 11
11 -
 12
12 -
 13
13 -
 14
14 -
15
-
16
-
17
-
18
-
19
-
20
-
21
-
22
-
23
-
24
-
25
-
26
 |
 |

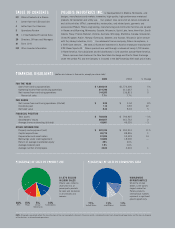
$1.89
02
$1.70
01
$1.52
00
$1.42
99
$1.27
9897
$3.04
$3.29
96 03 05
$2.07
$2.66
04
$2.36
$1,327
02
$1,245
01
$1,106
00
$948
99
$985
9897
$1,773
$1,870
96 03 05
$1,427
$1,552
04
$1,468
SALES
FROM CONTINUING OPERATIONS
(dollars in millions)
NET INCOME
FROM CONTINUING OPERATIONS
PER SHARE(1)
(dollars)
THE SCORECARD 2005 represents the 24th consecutive year of record earnings per share from continuing operations in a challenging
economic and industry environment. Polaris has consistently delivered increasing shareholder value through strong cash flow generation and
high returns on shareholder equity. The Company’s balance sheet remains strong with minimal debt, ample borrowing capacity and access to
the capital markets to fund our growth initiatives.
48%
02
53%
01
49%
00
47%
99
52%
9897
40%
39%
96 03 05
44%
40%
04
43%
RETURN ON AVERAGE SHAREHOLDER EQUITY
FROM CONTINUING OPERATIONS
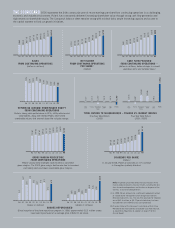
Historic strong sales performance in ATVs, utility vehicles and
snowmobiles, along with related PG&A, have fueled
shareholder returns that are well above the industry average.
21.7%
02
20.6%
01
19.3%
00
20.6%
99
19.5%
9897
23.9%
22.3%
96 03 05
21.5%
23.4%
04
22.6%
GROSS MARGIN PERCENTAGE
FROM CONTINUING OPERATIONS
Polaris’ productivity strategies have resulted in consistent
gross margins. The 2005 gross margin decline was due to increased
commodity costs and lower snowmobile gross margins.
–24.7%
4.9%
Polaris
4.5%
S&P
500
–14.7%
Russell
2000
1.7%
Recreational
Vehicles
Index
Dow
Jones
2.1%
Nasdaq
178.8%
2.8%
Polaris
48.5%
S&P
500
58.5%
Russell
2000
10.4%
Recreational
Vehicles
Index
Dow
Jones
–8.9%
Nasdaq
TOTAL RETURN TO SHAREHOLDERS – POLARIS VS. MARKET INDICES
One-Year Total Return
(2005)
Five-Year Total Return
(2001–2005)
$0.44
02
$0.40
01
$0.36
00
$0.32
99
$0.30
9897
$0.92
$1.12
96 03 05
$0.50
$0.62
04
$0.56
$129
02
$120
01
$109
00
$100
99
$96
9897
$201
$208
96 03 05
$150
$178
04
$174
DIVIDENDS PER SHARE
(dollars)
In January 2006, Polaris announced an 11% increase
in the regular quarterly dividend.
CASH FLOW PROVIDED
FROM CONTINUING OPERATIONS(1,2)
(dollars in millions, before changes in current
operating items and deferred taxes)
2.4
02
3.0
01
2.2
00
2.9
99
1.0
9897
1.4
2.4
96 03 05
2.2
2.5
04
2.4
$40
02
$52
01
$38
00
$40
99
$14
9897
$67
$132
96 03 05
$49
$73
04
$76
SHARES REPURCHASED
Since inception of the share repurchase program in 1996, approximately 22.3 million shares
have been repurchased at an average price of $26.01 per share.
(shares in millions) (dollars in millions)
(1) In 1998, Polaris entered into a settlement agreement related
to a trade secret infringement claim brought by Injection
Research Specialists, Inc. The one-time provision for litigation
loss of $61.4 million, or $0.77 per diluted share, has been
excluded from the 1998 financial data presented.
(2) A reconciliation of the Company’s calculation of Cash Flow
Provided to the most directly comparable cash flow measure,
as required by Regulation G, appears on page 19 of this
Annual Report.
NOTE: All periods presented reflect the classification of the
marine products division’s financial results, including the loss
from discontinued operations and the loss on disposal of the
division, as discontinued operations.