Pioneer 2011 Annual Report Download - page 4
Download and view the complete annual report
Please find page 4 of the 2011 Pioneer annual report below. You can navigate through the pages in the report by either clicking on the pages listed below, or by using the keyword search tool below to find specific information within the annual report.-
 1
1 -
 2
2 -
 3
3 -
 4
4 -
 5
5 -
 6
6 -
 7
7 -
 8
8 -
 9
9 -
 10
10 -
 11
11 -
 12
12 -
 13
13 -
 14
14 -
 15
15 -
16
-
17
-
18
-
19
-
20
-
21
-
22
-
23
-
24
-
25
-
26
-
27
-
28
-
29
-
30
-
31
-
32
-
33
-
34
-
35
-
36
-
37
-
38
-
39
-
40
-
41
-
42
-
43
-
44
-
45
-
46
-
47
-
48
-
49
-
50
-
51
-
52
-
53
-
54
-
55
-
56
 |
 |

Pioneer Corporation Annual Report 2011
02
–7.3
–17.5–54.5
–1.6
+7.5
+32.7 +15.8
+2.0
Impact from
Currency
Exchange
Impact
of the
Great
East Japan
Earthquake
Higher
Profit
Due to
Increased
Net Sales
Improvement
in Gross
Profit Margin
Decreased
SG&A
Expenses
FY2010
Operating
Loss
FY2009
Operating
Loss Improvement of 33.3 Billion Yen
FY2011
Operating
Income
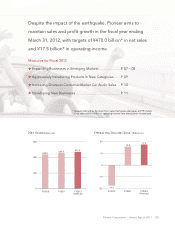
Bolstered by its growth strategy,
Pioneer recorded profi ts both in operating income and
net income for the fi scal year ended March 31, 2011.
Results of Fiscal 2011 and Measures for Fiscal 2012
Operating Income (Loss) Structure Breakdown (Billion yen)
Notable Achievements in Fiscal 2011
X
Growth Strategy Led to Turnaround in Profi tability
Achieved operating profi tability for the fi rst time in three years and
recorded fi rst net profi t in seven years
XSteady Growth in Each Business
Increased consumer-market car audio share
in the United States and Western Europe
Sales growth and return to profi tability in optical disc business through joint venture
with Sharp Corporation
XAlliance with NTT Docomo, Inc.
Launched a new car navigation business for smartphones from April 2011
XSignifi cant Improvement in Financial Position
Redeemed 60.0 billion yen of convertible bonds at maturity using cash on hand
Average share: United States FY2010: 18%; FY2011: 22%
Western Europe FY2010: 10%; FY2011: 12%
()