Pioneer 2008 Annual Report Download - page 8
Download and view the complete annual report
Please find page 8 of the 2008 Pioneer annual report below. You can navigate through the pages in the report by either clicking on the pages listed below, or by using the keyword search tool below to find specific information within the annual report.-
 1
1 -
 2
2 -
 3
3 -
 4
4 -
 5
5 -
 6
6 -
 7
7 -
 8
8 -
 9
9 -
 10
10 -
 11
11 -
 12
12 -
 13
13 -
 14
14 -
 15
15 -
 16
16 -
 17
17 -
 18
18 -
 19
19 -
20
-
21
-
22
-
23
-
24
-
25
-
26
-
27
-
28
-
29
-
30
-
31
-
32
-
33
-
34
-
35
-
36
-
37
-
38
-
39
-
40
-
41
-
42
-
43
-
44
-
45
-
46
-
47
-
48
-
49
-
50
-
51
-
52
-
53
-
54
-
55
-
56
-
57
-
58
-
59
-
60
-
61
-
62
-
63
-
64
-
65
-
66
-
67
-
68
-
69
-
70
-
71
-
72
 |
 |

6PIONEER CORPORATION
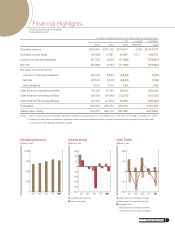
Review of Operations
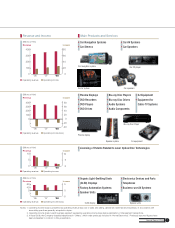
Car Electronics sales increased 4.5% year on year to ¥373.9 billion (US$3,738.8 million) due to higher
sales of both car navigation systems and car audio products. In car navigation systems, consumer-market
sales were mostly the same as in the previous fiscal year, while OEM sales increased in North America. In
car audio products, consumer-market sales increased in Central and South America, but decreased in
North America due to market contraction, while OEM sales rose in Japan, China and North America. Total
OEM sales in this segment accounted for approximately 39% of Car Electronics sales in fiscal 2008, com-
pared with approximately 36% in fiscal 2007.
Operating income in this segment rose 18.3% to ¥26.2 billion (US$261.5 million). This principally
reflected lower selling expenses for consumer-market products, such as advertising and sales promotion
expenses, despite higher development expenses in the OEM business.
CAR ELECTRONICS
In Patent Licensing, royalty revenue decreased 57.1% year on year to ¥2.0 billion (US$20.0 million).
This decrease was attributable to the impact of the expiration of some patents licensed to the optical
disc industry.
Operating income in this segment declined 59.5% to ¥1.6 billion (US$15.9 million), in line with
the decrease in royalty revenue.
PATENT LICENSING
Home Electronics sales decreased 8.8% year on year to ¥329.5 billion (US$3,295.3 million). Plasma
display sales declined due to a drop in sales volume mainly in North America and Europe. Plasma dis-
play sales accounted for approximately 40% of Home Electronics sales, compared with approximately
49% in the previous fiscal year. Sales of DVD drives and Blu-ray Disc-related devices rose, while sales of
DVD recorders fell.
The operating loss in this segment was ¥18.0 billion (US$179.7 million), compared with an operat-
ing loss of ¥15.8 billion in the previous fiscal year. This was mainly attributable to the larger loss in the
plasma display business due to falling sales, despite a smaller loss in DVD recorders reflecting a reduc-
tion in development expenses.
HOME ELECTRONICS
In the Others segment, sales decreased 5.5% year on year to ¥69.1 billion (US$690.7 million). This mainly
reflected lower sales of factory automation (FA) systems and business-use AV systems.
Operating income in this segment was ¥0.2 billion (US$1.6 million), down 93.4% year on year.
This was mainly attributable to lower profitability in FA systems and business-use AV systems due to
lower sales.
OTHERS
Business Segments
Year ended March 31, 2008