PNC Bank 2009 Annual Report Download - page 83
Download and view the complete annual report
Please find page 83 of the 2009 PNC Bank annual report below. You can navigate through the pages in the report by either clicking on the pages listed below, or by using the keyword search tool below to find specific information within the annual report.-
 1
1 -
2
-
3
-
4
-
5
-
6
-
7
-
8
-
9
-
10
-
11
-
12
-
13
-
14
-
15
-
16
-
17
-
18
-
19
-
20
-
21
-
22
-
23
-
24
-
25
-
26
-
27
-
28
-
29
-
30
-
31
-
32
-
33
-
34
-
35
-
36
-
37
-
38
-
39
-
40
-
41
-
42
-
43
-
44
-
45
-
46
-
47
-
48
-
49
-
50
-
51
-
52
-
53
-
54
-
55
-
56
-
57
-
58
-
59
-
60
-
61
-
62
-
63
-
64
-
65
-
66
-
67
-
68
-
69
-
70
-
71
-
72
-
 73
73 -
 74
74 -
 75
75 -
 76
76 -
 77
77 -
 78
78 -
 79
79 -
 80
80 -
 81
81 -
 82
82 -
 83
83 -
 84
84 -
 85
85 -
 86
86 -
 87
87 -
 88
88 -
 89
89 -
 90
90 -
 91
91 -
 92
92 -
 93
93 -
94
-
95
-
96
-
97
-
98
-
99
-
100
-
101
-
102
-
103
-
104
-
105
-
106
-
107
-
108
-
109
-
110
-
111
-
112
-
113
-
114
-
115
-
116
-
117
-
118
-
119
-
120
-
121
-
122
-
123
-
124
-
125
-
126
-
127
-
128
-
129
-
130
-
131
-
132
-
133
-
134
-
135
-
136
-
137
-
138
-
139
-
140
-
141
-
142
-
143
-
144
-
145
-
146
-
147
-
148
-
149
-
150
-
151
-
152
-
153
-
154
-
155
-
156
-
157
-
158
-
159
-
160
-
161
-
162
-
163
-
164
-
165
-
166
-
167
-
168
-
169
-
170
-
171
-
172
-
173
-
174
-
175
-
176
-
177
-
178
-
179
-
180
-
181
-
182
-
183
-
184
-
185
-
186
-
187
-
188
-
189
-
190
-
191
-
192
-
193
-
194
-
195
-
196
 |
 |

2008 V
ERSUS
2007
C
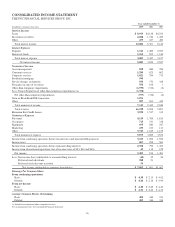
ONSOLIDATED
I
NCOME
S
TATEMENT
R
EVIEW
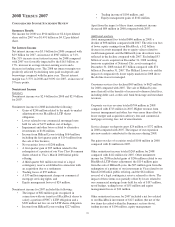
Summary Results
Net income for 2008 was $914 million or $2.44 per diluted
share and for 2007 was $1.491 billion or $4.32 per diluted
share.
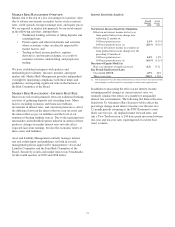
Net Interest Income
Net interest income was $3.9 billion for 2008 compared with
$2.9 billion for 2007, an increase of $907 million, or 31%.
The 31% increase in net interest income for 2008 compared
with 2007 was favorably impacted by the $16.5 billion, or
17%, increase in average interest-earning assets and a
decrease in funding costs. The 2008 net interest margin was
positively affected by declining rates paid on deposits and
borrowings compared with the prior year. The net interest
margin was 3.37% in 2008 and 3.00% for 2007, an increase of
37 basis points.
Noninterest Income
Summary
Noninterest income was $2.4 billion for 2008 and $2.9 billion
for 2007.
Noninterest income for 2008 included the following:
• Gains of $246 million related to the mark-to-market
adjustment on our BlackRock LTIP shares
obligation,
• Losses related to our commercial mortgage loans
held for sale of $197 million, net of hedges,
• Impairment and other losses related to alternative
investments of $156 million,
• Income from Hilliard Lyons totaling $164 million,
including the first quarter gain of $114 million from
the sale of this business,
• Net securities losses of $206 million,
• A first quarter gain of $95 million related to the
redemption of a portion of our Visa Class B common
shares related to Visa’s March 2008 initial public
offering,
• A third quarter $61 million reversal of a legal
contingency reserve established in connection with
an acquisition due to a settlement,
• Trading losses of $55 million,
• A $35 million impairment charge on commercial
mortgage servicing rights, and
• Equity management losses of $24 million.
Noninterest income for 2007 included the following:
• The impact of $82 million gain recognized in
connection with our transfer of BlackRock shares to
satisfy a portion of PNC’s LTIP obligation and a
$209 million net loss on our LTIP shares obligation,
• Income from Hilliard Lyons totaling $227 million,
• Trading income of $104 million, and
• Equity management gains of $102 million.
Apart from the impact of these items, noninterest income
decreased $89 million in 2008 compared with 2007.
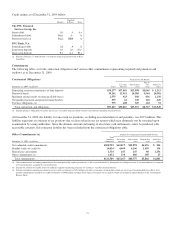
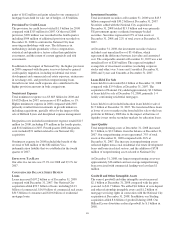
Additional analysis
Asset management fees totaled $686 million in 2008, a
decline of $98 million compared with 2007. The effect on fees
of lower equity earnings from BlackRock, a $12 billion
decrease in assets managed due to equity values related to
wealth management, and the Hilliard Lyons divestiture were
reflected in the decline compared with 2007. Excluding $53
billion of assets acquired on December 31, 2008 resulting
from our acquisition of National City, assets managed at
December 31, 2008 totaled $57 billion compared with $74
billion at December 31, 2007. The Hilliard Lyons sale and the
impact of comparatively lower equity markets in 2008 drove
the decline in assets managed.
Consumer services fees declined $69 million, to $623 million,
for 2008 compared with 2007. The sale of Hilliard Lyons
more than offset the benefits of increased volume-related fees,
including debit card, credit card, bank brokerage and merchant
revenues.
Corporate services revenue totaled $704 million in 2008
compared with $713 million in 2007. Higher revenue from
treasury management and other fees were more than offset by
lower merger and acquisition advisory fees and commercial
mortgage servicing fees, net of amortization.
Service charges on deposits grew $24 million, to $372 million,
in 2008 compared with 2007. The impact of our expansion
into new markets contributed to the increase during 2008.
Net gains on sales of securities totaled $106 million in 2008
compared with $1 million in 2007.
Other noninterest income totaled $263 million for 2008
compared with $412 million for 2007. Other noninterest
income for 2008 included gains of $246 million related to our
BlackRock LTIP shares adjustment, the $114 million gain
from the sale of Hilliard Lyons, the $95 million gain from the
redemption of a portion of our investment in Visa related to its
March 2008 initial public offering, and the $61 million
reversal of a legal contingency reserve referred to above. The
impact of these items was partially offset by losses related to
our commercial mortgage loans held for sale of $197 million,
net of hedges, trading losses of $55 million and equity
management losses of $24 million.
Other noninterest income for 2007 included a net loss related
to our BlackRock investment of $127 million (the net of the
two items described within the Summary section above),
trading income of $104 million, equity management
79