Omron 2015 Annual Report Download - page 17
Download and view the complete annual report
Please find page 17 of the 2015 Omron annual report below. You can navigate through the pages in the report by either clicking on the pages listed below, or by using the keyword search tool below to find specific information within the annual report.-
 1
1 -
2
-
3
-
4
-
5
-
6
-
 7
7 -
 8
8 -
 9
9 -
 10
10 -
 11
11 -
 12
12 -
 13
13 -
 14
14 -
 15
15 -
 16
16 -
 17
17 -
 18
18 -
 19
19 -
 20
20 -
 21
21 -
 22
22 -
 23
23 -
 24
24 -
 25
25 -
 26
26 -
 27
27 -
28
-
29
-
30
-
31
-
32
-
33
-
34
-
35
-
36
-
37
-
38
-
39
-
40
-
41
-
42
-
43
-
44
-
45
-
46
-
47
-
48
-
49
-
50
 |
 |

Portfolio Management Categories
ROIC (%)
B
Expecting
Growth
S
Investment
C
Profit
Restructuring
A
Examining
Regrowth
Sales Growth (%)
1. Management of a Portfolio of 100 Businesses
Omron consists of six business segments
made up of nearly 100 distinct business units.
We consider these business units to be our
portfolio of investments. So, how do we
measure the results of our portfolio? First, we
create an index with return on invested capital
(ROIC) as the X axis and revenue growth as
the Y axis. Next, we categorize each of our
businesses under one of four headings: S, A,
B, or C. Businesses we consider to be an S
demonstrate promise for strong, sustainable
growth. These are the businesses to which
we give priority investment. We pay close
attention to these businesses to drive even
more growth where we see the opportunity
for robust, ongoing earnings.
Some businesses we categorize as C
(target for profit restructuring). For these
businesses, we focus on creating and exe-
cuting plans to restructure their revenue
bases. In some cases, we pull out from the
business entirely. Over the past few years,
we have been active in exiting businesses,
closing factories, or otherwise restructuring
businesses that fall under this category.
Not every one of our business units is nec-
essarily large. As a matter of fact, you could
say that Omron is a collection of many small-
and medium-sized businesses. The important
take-away here is that Omron produces highly
competitive products based on sensing and
control technologies, marketed globally in
nearly 100 different business sectors. This
large number of businesses is precisely why
we have to exercise effective portfolio man-
agement. The type of detailed portfolio control
we conduct allows us to optimize the alloca-
tion of our resources to create more strength
within each business unit, leading to higher
levels of corporate value.
2. Growth through Investment
As part of our strategy to rapidly grow in
emerging economies, Omron acquired NS
Industria de Aparelhos Medicos Ltda. in
October 2014. NS is a top manufacturer of
nebulizers in Brazil, and this acquisition has
vaulted our Healthcare Business to the top
share of the global nebulizer market. At the
same time, this new sales channel within
Brazil took us to the number one share for
blood pressure monitors in that market
during fiscal 2014. Prior to our investment,
the Brazilian market had presented challeng-
es in marketing our blood pressure monitors.
We have increased the pace of investment
in our Backlights Business to win a greater
share of growing demand. Our EARTH-1
STAGE (FY2014–FY2016) defined the estab-
lishment of a self-driven growth structure as
the medium-term goal for our company. To
achieve this goal, management has budgeted
¥100 billion in growth investments for the
Company as a whole, and we intend to contin-
ue to invest in our future for sustained growth.
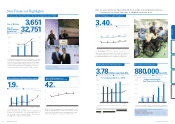
3. Improving Shareholder Return
Between October and November 2014, we
took the opportunity to address shareholder
return and our capital structure by buying
back almost 2.82 million shares of stock for a
total of nearly ¥15 billion. In December, we
retired approximately 9.72 million shares of
new and existing treasury stock, leaving us
with a balance of approximately 140,000
treasury shares.
In terms of dividends, we committed in our
EARTH-1 STAGE plan to increase our divi-
dend payout ratio to 30% by FY2016. We
are happy to announce that we have moved
the timing up by one year, with a scheduled
30% payout ratio for FY2015. While we
have not changed our basic stance in placing
the highest priority on growth investments,
we believe offering stronger shareholder
return is another way to make efficient use
of our capital.
30 OMRON Corporation Integrated Report 2015 31
About Omron Where We’re Headed Corporate Value Initiatives Corporate Value Foundation Financial Section